

Introducing the RoCA Benchmark 3.0 Model
A method to forecast local housing needs

Highlights
Today, MMI released its RoCA Benchmark 3.0 Model to estimate housing shortages and future housing needs. Please download the full report at the end of this article.
All three orders of government in Canada require housing needs forecasts to enable better decision-making, from infrastructure investment decisions to how much land to set aside for development.
Several methods exist to generate housing needs forecasts as well as housing shortage estimates, including the Rest of Canada Average Benchmark method (RoCA Benchmark method), pioneered by MMI’s precursor, the PLACE Centre.
The first two versions of the RoCA Benchmark method, while incredibly useful, suffered from two flaws: the first being that defining British Columbia and Ontario circa 2016 as “unaffordable” and every other province (at that time) as “affordable” was arbitrary.
The second is that while it provided reasonable estimates at a provincial level, it treated the needs of all communities as the same, so it tended to overestimate the needs for apartments in small, rural communities and underestimate them in other communities.
This paper introduces version 3.0 of the model, which differentiates communities into three types (low, medium, and high-apartment share communities), and examines affordability at the Census Division, rather than the provincial level. Communities are designated as affordable if their price-to-couple after-tax income is below three, except for high-apartment share communities, where the cut-off is four.
With this definition, new housing need parameters are estimated, which can be used to conduct assessments of housing needs and housing shortages.
Not surprisingly, the analysis finds that affordable communities have more homes per resident over the age of 14, relative to their unaffordable counterparts.
The method also finds that as a community’s share of apartments rises, it needs more homes per capita to retain affordability, as apartments tend to house fewer people than ground-oriented homes.
Canada has not yet figured out how to create communities that simultaneously have large populations, a high proportion of apartments, and are affordable or attainable to the middle class. The push towards higher densification will ultimately fail if it prices out the middle class. Hopefully, this version of the RoCA Benchmark can assist policymakers who aim to establish communities with all three features.
The development of a new model
All three orders of government in Canada require housing needs forecasts to enable better decision-making, from infrastructure investment decisions to how much land to set aside for development. For example, Ontario's Ministry of Finance is seeking feedback on "developing a municipal level forecast of housing by type (e.g., low, medium, high density) and location (e.g., intensification within settlement areas) based on housing needs by age cohort" to assess land needs.
Several competing methods have been developed in Canada to estimate pre-existing housing shortages and convert population projections into housing needs forecasts. These models include CMHC's framework, the Parliamentary Budget Office's housing gap estimator, Carolyn Whitzman's human-rights-based approach, and von Bergmann and Lauster's Montréal Method, to name a few.
In the 2021 report, Baby Needs a New Home and the 2022 follow-up Ontario's Need for 1.5 Million Homes, the PLACE Centre (the precursor to the Missing Middle Initiative) developed the Rest of Canada Average Benchmark method (RoCA Benchmark method). The RoCA Benchmark method was based on the twin observations that, in 2016, housing was relatively attainable for families with middle-class incomes in every province except British Columbia and Ontario, and that, after taking demographics into account, the per capita housing supply was also higher in those eight provinces than it was in British Columbia and Ontario.
The model, while useful, did not differentiate between different types of homes. In 2025, MMI created the RoCA Benchmark 2.0 method, which divided homes into four different classifications:
Ground-oriented owner-occupied housing
Ground-oriented rental housing
Apartment owner-occupied housing
Apartment rental housing
This change was made to reflect that different families have different housing needs, and that an individual or family's housing needs can change over time.
While an improvement on the first benchmark, the revised version had limitations. First, the designation of 2016 Ontario and British Columbia as "unaffordable" and other provinces as "affordable" was arbitrary. Secondly, it treated all communities as identical, suggesting the proportion of apartments in large, dense urban centres should be identical to rural communities.
These limitations created the need to develop a RoCA Benchmark v3.0 model, which is outlined in this paper. The method makes two substantive changes to the v2.0 model:
Classifies communities, at the Census Division level, into three types: High apartment concentration (apartments made up 49% or more of all units in 2016), medium apartment concentration (25-49% in 2016), and low apartment concentration (0-25% in 2016).
Defines affordability for medium- and low-apartment concentration communities to be any community where the price-to-after-tax price ratio was under 3-to-1 (based on Census 2016 data), and under 4-to-1 for high-apartment concentration communities (in 2016, there were no high-apartment concentration communities with a price-to-income ratio of under 3).
These changes now create a more structured way of separating communities into "affordable" and "unaffordable" categories, addressing the issue with the previous method, which overestimated the need for apartments in rural areas and underestimated the need in urban areas.
Six sets of age-adjusted headship rates, by housing type, were estimated for each combination of apartment concentration and affordability level, based on Census 2016 data. The headship rates for the "affordable" communities can then be used as the parameters to estimate both existing housing shortages and to convert population growth projections into housing need forecasts, at the Census Division level.
The process of creating v3.0 of the RoCA Benchmark model led to several important insights:
Affordable communities have, on average, 2-4 more housing units per 100 adults than their unaffordable counterparts. This phenomenon holds for all apartment-level concentrations.
Affordable medium- and high-apartment concentration communities have 2-4 more housing units per 100 adults than their affordable low-apartment concentration counterparts. Because apartments house fewer people than ground-oriented housing, as communities densify, they need to create more units per capita.
For all apartment-concentration levels, affordable communities have, on average, 1-7 more ground-oriented homes per 100 adults than their non-affordable counterparts.
For all apartment-concentration levels, affordable communities have more rental apartments per 100 adults than non-affordable communities.
For all apartment-concentration levels, affordable communities have fewer apartment condos per 100 adults than non-affordable communities. This result is likely because communities shift away from ground-oriented housing construction and towards apartment condo construction as the middle-class gets priced out of ground-oriented housing, and not because condo construction causes unaffordability.
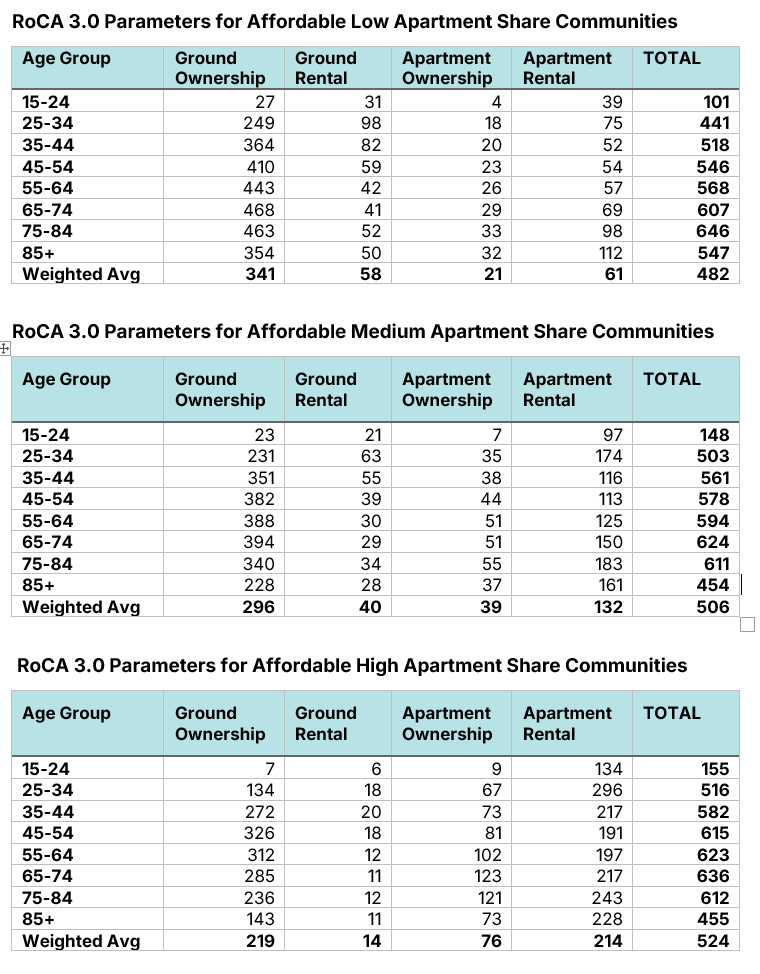
The RoCA Benchmark v3.0 parameters are below. The “75” at the intersection of “25-34 year olds” and “Apartment Rental” in the first table indicates that for every 1,000 residents in that age category, 75 rental apartments are needed to maintain affordability.
This summary scratches the surface. For full details on the methodology, along with results, please download the full report, found below.