Toronto’s Housing Collapse Will Cost Governments $6.6 Billion a Year
The evaporation of new housing sales in the GTA could cost governments $6.6 billion per year
Highlights
In the first five months of 2025, housing starts are down 58% in the City of Toronto and 29% in the rest of the GTA compared to 2024.
This decline is part of a trend, as the number of starts fell by 10% in the City of Toronto, 22% in the rest of the GTA, and 26% in Ontario's metropolitan areas outside the GTA between 2022 and 2024.
New home sales paint an even more bleak picture, with the sale of new single-family homes in the GTA down 73% from ten-year averages and new condo sales down 90%.
An Altus Group report presents a scenario analysis that assumes further trends will continue. In that scenario, new single-family home sales in the GTA could decline from 10,000 to 3,000 units per year, and new condo apartment sales could decrease from 22,000 to 2,000 units per year. Under such a scenario, 41,000 jobs would be lost in the GTA.
The unemployment rate in the GTA is already at 9.7% (up from 8.3% a year ago), and Ontario has shed nearly 12,000 construction jobs over the last 12 months.
A rough back-of-the-envelope calculation suggests that under the Altus scenario, the combined fiscal impact on all three levels of government, through reduced tax revenue, would be approximately $6.5 billion per year.
While governments consider the fiscal cost of housing policy actions, such as revising HST New Housing Rebates, they should also consider the fiscal cost of inaction.
When promises and reality diverge
Despite federal and provincial commitments to double housing starts, new housing construction in the GTA is in freefall, particularly in the City of Toronto. Despite this, policymakers have shown little concern for a situation that will cost tens of thousands of jobs, billions of dollars in tax revenue per year, and set the stage for the next significant real estate price spike, as housing supply fails to keep pace with population growth.
Here’s what the numbers tell us.
Housing starts have evaporated in the GTA
Ontario’s Financial Accountability Office made headlines when its quarterly economic monitor revealed that housing starts in the province have hit lows not seen since the 2008-09 Financial Crisis. Relative to 2024, this drop in housing starts is not uniform across the province, with housing starts falling nearly 60% in the City of Toronto and nearly 30% in the rest of the GTA, while starts remain flat in metros in the rest of Ontario.
Figure 1: Housing Starts, Number of Units, by Location in Ontario (All Types, Jan-May 2024 vs. Jan-May 2025)
Source: Author’s Calculation; Data from CMHC Housing Market Information Portal.
What makes this comparison even more concerning is that 2024 was not a particularly good year for homebuilding in Ontario. Between 2022 and 2024, housing starts decreased by 10% in the City of Toronto, 22% in the rest of the GTA, and 26% in Ontario metropolitan areas outside of the GTA. The 2025 decline in Ontario housing starts is a continuation of an ongoing trend.
Figure 2: Housing Starts, Number of Units, by Location in Ontario (All Types, Full Year)
Source: Author’s Calculation; Data from CMHC Housing Market Information Portal.
And as bad as housing starts are right now in the GTA, they are about to get a whole lot worse.
And sales are even worse than starts
One of the most misunderstood metrics in housing is the “housing start”. To the layperson, a housing start might mean when the builder obtains all their necessary permissions, or perhaps when the first shovel goes into the ground. In reality, the Canadian Mortgage and Housing Corporation (CMHC), the agency responsible for collecting the data, does not count a housing project as a “housing start” until the foundation is complete and at grade.
Figure 3: Visual Definition of a Housing Start
Source: CMHC Housing Start Presentation to AMO.
For a high-rise project (either a purpose-built rental or condominium), it can take years, relative to when the developer obtains financing, for the building to reach the level of completion required to be considered a “housing start”. As such, it serves as a lagging indicator of the health of the housing market.
The sales of new homes, on the other hand, provide a more up-to-date picture of the state of the (non-rental) market, and can be used as a predictor of where housing starts will be a year or two from now. Because of that, by using sales data, we can be reasonably confident about the path of housing start data over the next 18-36 months.
An Altus Group report prepared for BILD paints a bleak picture of the state of GTA new housing sales. Relative to the same January-to-May period last year, single-family new home sales are down 51%, and new condo sales are down 65% in the GTA. Relative to 10-year averages, sales are down 73% and 90% respectively.
Figure 4: Sales of New Homes in the GTA by Type, January to May by Year
Source: BILD New Homes Monthly Market Report - Data as of May 2025
As with housing starts, the decline in home sales did not begin in 2025. In 2024, single-family home sales were 51% lower than the 10-year average, and apartment sales were 78% lower. This represents a decline of approximately 5,000 single-family homes and 17,000 condo apartments.
Figure 5: Sales of New Homes in the GTA by Type and Year
Source: BILD New Homes Monthly Market Report - Data as of December 2024
Low sales will lead to future drops in starts and, ultimately, completions
In a separate Altus Group report prepared for BILD, the group provides a scenario analysis of housing starts and completions for the GTA out to 2029, assuming current trends continue. Although housing completions will still be relatively strong in 2025 and 2026 under this scenario, due to projects currently under construction, they eventually fall as housing starts and construction investment largely evaporate without a rebound.
Figure 6: Projected Housing Starts, Completions, and Investment, in Status-Quo Scenario
Source: Altus Group
The Altus Scenario projects single-family ownership home starts to decline from the 10-year average of 10,380 to 3,000, and condo apartment home starts to fall from 21,646 to 2,000, with purpose-built rental starts remaining at current elevated levels.
Under such a scenario, approximately 41,000 jobs would be lost; 18,500 in jobs directly associated with housing construction (47% of the GTA’s direct housing construction workforce), and an additional 21,000 would be lost in indirect and other jobs. And that’s assuming that rental starts remain high; if those should decline as well, the employment situation would become even more dire.
This job loss would not come at a worse time
There is never a good time for job loss, of course, but the GTA’s economy is already struggling. Statistics Canada reports that the number of unemployed persons in the GTA has increased by 64,000 over the past year, resulting in an unemployment rate of 9.7%, up from 8.3% the previous year.
Figure 7: Labour Market Indicators, Toronto CMA, May 2024 vs. May 2025
Source: Author’s Calculation; Data from Statistics Canada Table 14-10-0460-01.
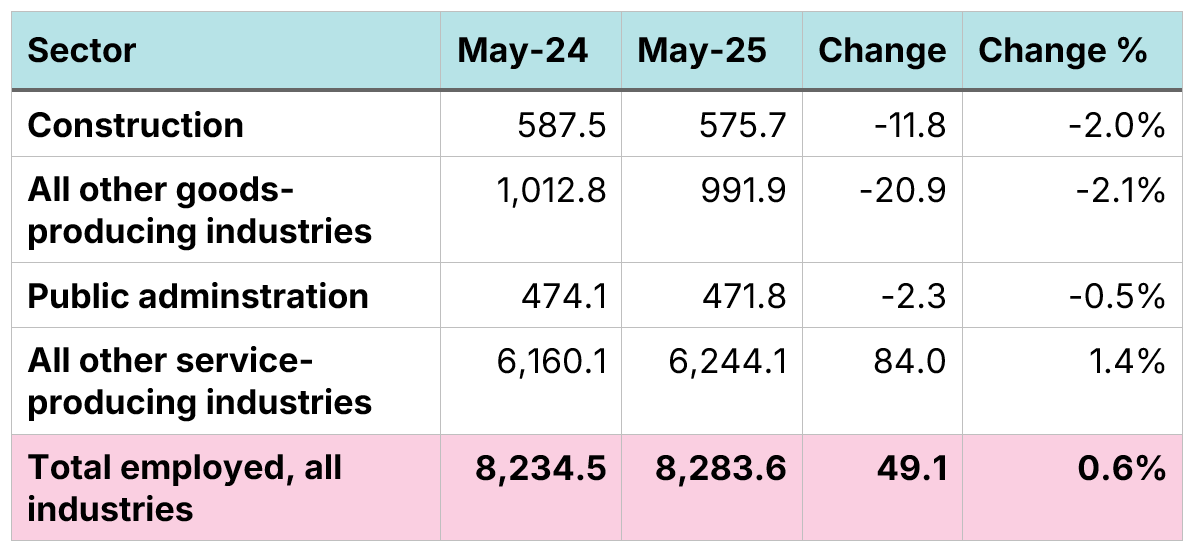
The fall in housing starts is likely already contributing to Toronto’s weak labour market. Provincial-level data reveal that there are nearly 12,000 fewer construction-related jobs than there were a year ago. General weakness in the goods-producing sector, a slow-growing economy, and ongoing trade tensions are also likely contributing factors.
Figure 8: Ontario, Employment Levels (in 000s) by Industry
Source: Author’s Calculation; Data from Statistics Canada Table 14-10-0355-01.
The loss of tens of thousands of jobs and over $10 billion a year in residential housing construction investment will have a significant impact on government tax revenue.
Without significant reforms, governments are likely to take a multi-billion-dollar financial hit
Housing construction and sales generate billions of dollars in revenue annually for all three orders of government. Municipalities in Ontario collect over $ 4 billion annually in development charges. Ontario’s land transfer tax generates nearly $4 billion for the provincial government each year, and Toronto’s municipal land transfer tax brings in an additional $900 million. There are additional taxes, such as sales taxes, on new homes, as well as all the income taxes paid by workers and corporations in the housing construction industry.
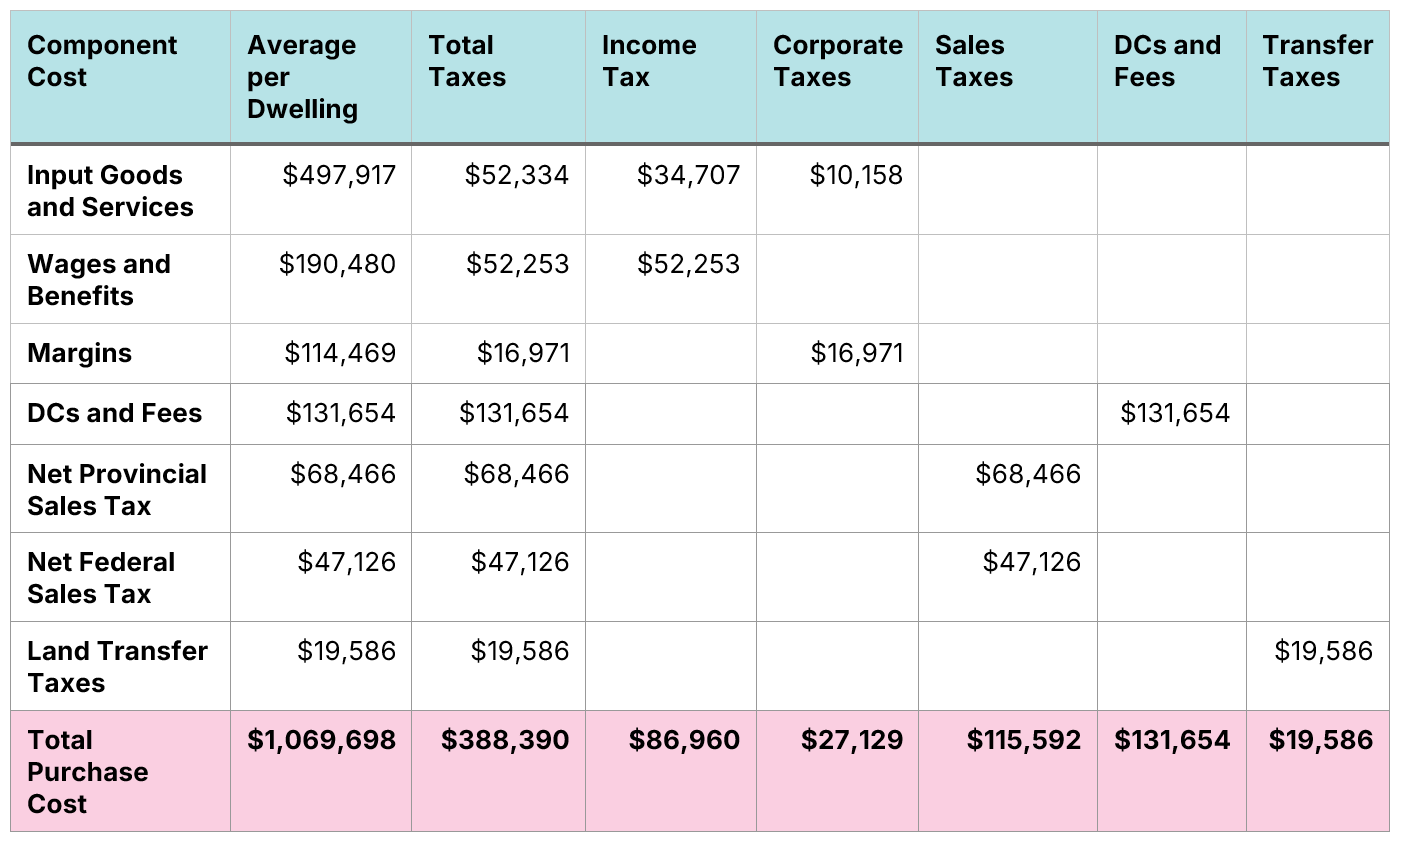
The Canadian Centre for Economic Analysis’s (CCEA) report The Increasing Tax Burden on New Ontario Homes: 2024 analyzed these taxes for a $1 million single-family home in Ontario. By their estimate, each home generates approximately $390,000 in taxes, spread across all three orders of government.
Figure 9: Tax Revenue per Single-Family Home
Source: The Increasing Tax Burden on New Ontario Homes: 2024.
These figures represent averages and will vary substantially depending on the cost of the home, as well as the municipality. There are large differences in development charges across municipalities, and the City of Toronto has a municipal land transfer tax (which does not appear to be incorporated in the CCEA report, whereas other municipalities do not.
Despite these differences, we can use the CCEA’s estimates to create a very rough “back-of-the-envelope” estimate of the direct revenue loss to governments from the Altus Group housing start scenario.
Specifically, we will assume:
Single-family home sales/starts/completions fall from 10,000 a year to 3,000, a drop of 7,000 units.
Condo apartment sales/starts/completions fall from 22,000 a year to 2,000, a drop of 20,000 units. Because condo units are significantly less expensive than single-family homes, we will divide the CCEA estimates in half for condos, which would bring the purchase cost to $535,000 a unit. This is an underestimate, but we would prefer to be conservative. Therefore, the loss of 20,000 condo units per year will be treated, for revenue purposes, as equivalent to 10,000 single-family homes.
To estimate the annual loss to governments, we multiply the per-unit tax revenue estimate by 17,000 (7,000 for single-family homes and 10,000 for condo units). Under such a scenario, governments would see their annual direct tax revenue fall by a combined $6.6 billion per year.
Figure 10: Tax Revenue Loss Under Altus Group GTA Housing Start Decline Scenario
Source: Author’s Calculation, Data From The Increasing Tax Burden on New Ontario Homes: 2024.
This is a rough estimate and should be treated as such. It is almost certainly an underestimate, as it only incorporates the direct impact of a reduction in homebuilding and does not account for the loss of jobs through the supply chain, nor does it consider the impact on the employment insurance system of 41,000 workers transitioning from paying into the system to collecting benefits.
This is a crisis, and should be treated as such
The loss of 41,000 jobs, 27,000 annual housing starts, and $6.6 billion in annual tax revenue would push the GTA’s unemployment rate into double digits. It not only pushes us further away from our short-term goal of doubling housing starts, but it also makes it more challenging to reach that goal in the long term, as a struggling industry will not be able to attract and retain the workers it needs to build homes when the market recovers.
There are solutions to this crisis, which involve directly addressing the cost-of-delivery challenges that plague the sector. An enhanced HST New Housing Rebate for owner-occupiers would immediately reduce the cost of a newly constructed home in Ontario by nearly 13%, helping to bring prices down to more attainable levels for families. While this action does have a fiscal cost (an estimated $1.6 billion per year for the federal government, and $895 million for the provincial government), we must also consider the fiscal cost of inaction, which is considerably higher.
Download a PDF of this article:


