

Can Homes Become Affordable Without Prices Going Down?
They can, but it would take about 20 years

Highlights
Some believe that prices don’t need to fall for single-family homes to become affordable again to Canada’s middle class. If home prices merely stay flat, homes will eventually become affordable again due to rising wages.
Over the last twenty years, nominal wages have grown by about 3% a year, so it is true that if home prices remain flat and wages continue to grow at historic rates, home prices will become more affordable over time.
However, in communities such as Kitchener-Waterloo and Chilliwack, it would take over two decades for wages to grow enough to cause single-family homes to become once again affordable to middle-class families. In other markets like Oakville and Fraser Valley, it would take 40 years.
Quantifying common sense
In a must-read piece at the Toronto Star, Missing Middle Podcast co-host Sabrina Maddeaux wrote that the only pathway to housing affordability is a drop in home prices:
It’s basic common sense: for homes to become affordable again, prices must come down. After years of double-digit increases in many Canadian markets, there’s simply no other path for costs to realign with what the average Canadian worker can save and pay. Waiting for wages to catch up would be a decades-long endeavour, permanently shutting multiple generations out of ownership. Given advances in genetic engineering, pigs could very well literally fly faster than this would take.
Being the quant that he is, Sabrina’s co-host, Mike Moffatt, had to test this claim. If we relied solely on wage growth, how long would it take for homes to become affordable again?
The short answer confirms that Sabrina is correct and that it would, in fact, take decades. In large parts of southern Ontario, two to be exact. But here’s the long answer, examining every housing market in Canada.
Returning housing affordability to 2005 levels
Let’s estimate the time it would take for housing affordability in each Canadian market to return to January 2005 levels, assuming no changes in price. We chose January 2005 as it is the first period in CREA’s monthly home price database.
First, we will assume that nominal home prices stay at their December 2024 level, which is the latest month in our database. This would mean that the sticker price of those homes does not change, but the value of those homes erodes over time due to inflation. For this piece, we will examine single-family homes.
Second, we will assume that five-year mortgage rates will not substantially change. Currently, rates are at the same level as 20 years ago. For this exercise, we’ll assume they stay at this level in the future, as our hypothetical relies solely on nominal wage growth to drive affordability changes.
Figure 1: Canada - 5-year fixed mortgage rates
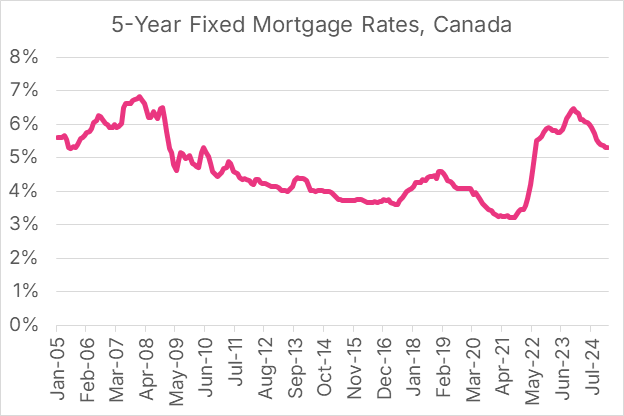
Source: Statistics Canada’s Table 34-10-0145-01
By assuming mortgage rates will not change in the future, we don’t have to worry about monthly payments fluctuating as rates change, so that we can use the simple price-income ratio as our measure of affordability. The price-to-income ratio measures the price of a home relative to a family’s pre-tax income. So if a family earns $100,000 of (pre-tax) income in a year and purchases a home for $450,000, the price-to-income ratio of the home is 4.5. The higher the price-to-income ratio, the less affordable the home.
Third, we will assume that median nominal wages grow at 3% a year, which has been their growth level over the previous twenty years in Canada. This roughly translates to wages rising 2% a year to keep pace with inflation, and 1% annual growth in real (inflation-adjusted) wages. We can test this sensitivity of the 3% wage growth assumption by plugging in alternative values to analyze scenarios where wage growth speeds up or slows down. Figure 2 shows the estimated growth of median annual family income in Ontario since 2005.
Figure 2: Ontario - Median weekly earnings translated to annual family income
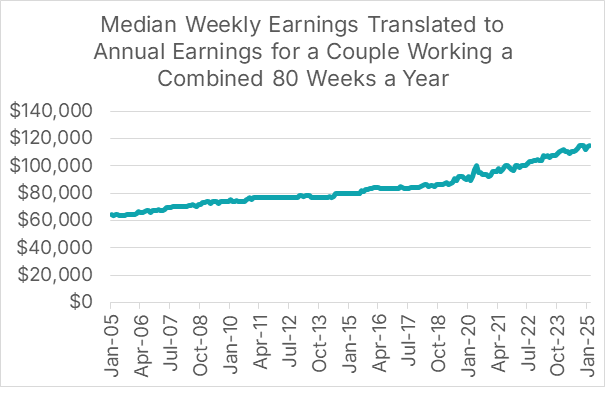
Sources: Statistics Canada’s Table 14-10-0063-01 and Table 98-10-0058-01, Author’s Calculation. Methodology can be found in Southern Ontario’s Home Affordability Crisis Remains at Near-Record Levels.
Price-Income ratios have skyrocketed over time
Across Canada, price-income ratios, which measure median incomes against average home prices, have increased by over 70% since January 2005, creating massive affordability changes. Note that we’re not measuring the price-income ratio for any individual homebuyer, but rather how much income it would take a median-income family to buy the average single-family home. In many markets, the median-income family has been priced out of single-family homes.
These increases in price-income ratios over time were not evenly distributed, with some markets increasing more than others. To keep this piece manageable, we will focus on nine markets: Calgary, Fraser Valley, Halifax-Dartmouth, Kitchener-Waterloo, Montreal, Oakville-Milton, Saskatoon, St. John’s, and Tillsonburg. We will also include CREA’s aggregate Canada-wide measure. At the end of this piece, we will include data on all the markets tracked by CREA’s MLS HPI tool. For this piece, we’re examining single-family home prices, though as shown in the article Southern Ontario’s Home Affordability Crisis Remains at Near-Record Levels, for any given market, home prices have grown by the same roughly proportion, regardless of the type of home.
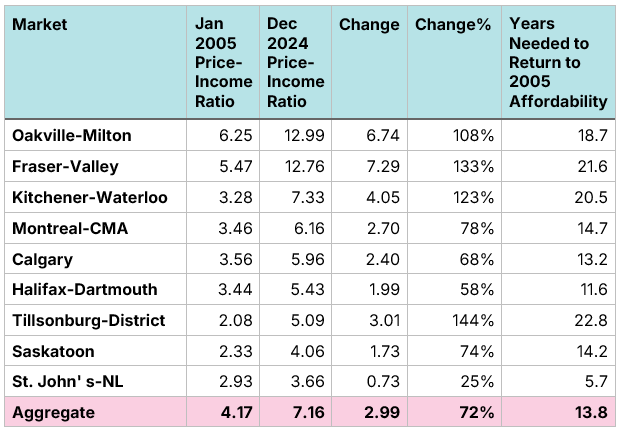
Of our nine reference markets, St. John’s had the lowest growth in price-income ratios, of 25%, while our three Ontario markets and Fraser Valley saw price-income ratios more than double.
Figure 3: Home price to pre-tax family income ratios, single-family homes, January 2005 and December 2024, selected Canadian markets
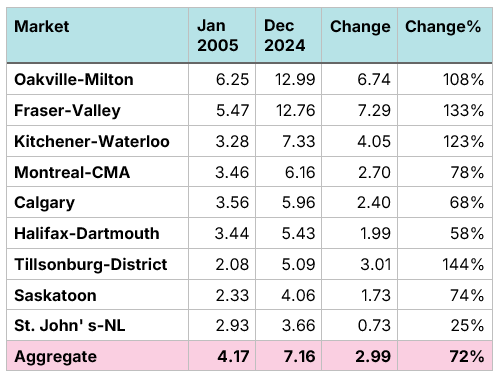
Sources: Author’s Calculation. Methodology can be found in Southern Ontario’s Home Affordability Crisis Remains at Near-Record Levels. Home prices are estimated at the local level, whereas incomes are calculated at the provincial level.
It will take us two decades to return to 2005 levels of affordability
We can then estimate how long it would take to return to the price-income ratios of January 2005, if prices did not change but incomes kept growing by 3% per year. For St. John’s, it would take just under 8 years, while for Tillsonburg, it would take over 30. Our Canada-wide measure shows it would take over 18 years, with our selected British Columbia and Ontario markets each taking over 25.
Figure 4: Length of time to return price-income ratios to January 2005 levels, assuming no change in nominal home prices and annual nominal wage growth of 3% per year
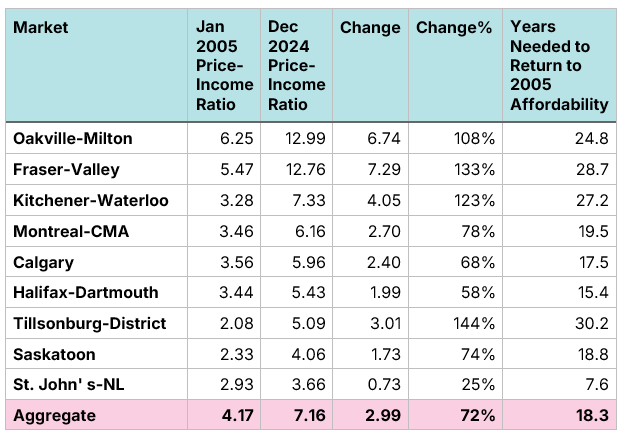
Sources: Author’s Calculation.
Perhaps the solution is faster nominal wage growth. Suppose we could get nominal wage growth up to 4% (rather than 3%), either through higher levels of inflation or higher levels of real wage growth. Having higher rates of inflation creates a whole host of other problems, so let’s not do that and instead focus on higher levels of real wage growth.
Increasing nominal wage growth from 3% to 4% solely through higher real wage growth would be a Herculean task. Recall that our 3% nominal wage growth is a combination of 2% inflation and 1% annual wage growth. Getting to 4% nominal wage growth without increasing inflation would mean doubling the annual rate of real (after-inflation) wage growth from 1% to 2%. But we are fans of Big Hairy Audacious Goals at the Missing Middle, so let’s shoot for the stars.
Increasing nominal wage growth from 3% to 4% shaves nearly 25% off of the time it would take to return to 2005 levels of affordability. For our Canada-wide measure, that reduces the overall time to 13.8 years, while in Kitchener-Waterloo, Tillsonburg, and Fraser Valley, it would still take over 20 years. Even if we could somehow double the rate of real-wage growth, the oldest Millennials would be 65 years old and receiving Canada Pension Plan payments by the time housing returned to 2005-levels of affordability in Kitchener-Waterloo.
Figure 5: Length of time to return price-income ratios to January 2005 levels, assuming no change in nominal home prices and annual nominal wage growth of 4% per year
Sources: Author’s Calculation.
Clearly, this approach isn’t going to work. Waiting 20 years to restore affordability would mean pricing out an entire generation of middle-class families from housing.
However, perhaps our perspective is wrong. Perhaps we should not seek to return to a lost, and somewhat arbitrary, golden era of affordability. Perhaps we would be better off trying to achieve an absolute affordability target. Let’s try that instead.
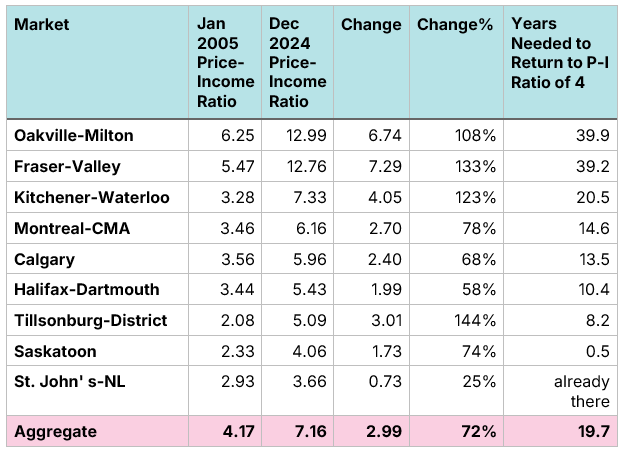
It could take up to 50 years to achieve an affordable price-income ratio of 4
Our WHAM Score methodology considers home prices, wages, and five-year fixed mortgage rates to classify markets into five categories: deeply affordable, affordable, unaffordable, deeply unaffordable, and completely unattainable.
The cut-off point between “affordable” and “deeply unaffordable” is a WHAM Score of 150. For any given five-year mortgage rate, we can translate this WHAM Score to a price-income ratio. Currently, five-year mortgage rates are at 5.29%. When rates are at 6%, a WHAM score of 150 is equivalent to a price-income ratio of 3.67. When they are at 4%, a WHAM score of 150 is equivalent to a price-income ratio of 4.13. Because the carrying cost of a mortgage is lower when rates are lower, “affordability” can be reached at higher price-to-income ratios.
Let’s examine what it would take for each of our markets to achieve a price-to-income ratio of 4, which is still higher than the old personal finance guideline of “Limit the value of your target home to no more than 3X your annual household gross income”.
Figure 6 shows that it would take 40 years of aggregate wage growth, with no increase in nominal home prices, for housing to reach this threshold of affordability in Oakville, and over 20 years for Kitchener-Waterloo. Greater Vancouver, not shown on the chart, would take 50 years. Contrast this to St. John’s, which has already achieved this level of affordability, and Saskatoon, which could get there in less than a year.
Figure 6: Length of time to achieve a price-income ratio of 4, assuming no change in nominal home prices and annual nominal wage growth of 3% per year
Sources: Author’s Calculation.
Note that in 2005, seven of nine markets on our chart had a price-income ratio under four. Today, this is unthinkable in most markets in Ontario and British Columbia.
It could take up to 40 years to achieve an unaffordable price-income ratio of 5
Perhaps we have set our sights too high and should instead look for home prices to become merely “unaffordable.” The dividing line between “unaffordable” and “deeply unaffordable” is a WHAM score of 200. When rates are at 6%, a WHAM score of 200 is equivalent to a price-income ratio of 4.83. When they are at 4%, a WHAM score of 150 is equivalent to a price-income ratio of 5.38, so let’s use five as our target price-income ratio.
To achieve mere “unaffordability,” Oakville would still need over 30 years of wage growth, with no increase in home prices, to reach this threshold. Kitchener-Waterloo would need over a decade, though Tillsonburg could achieve this by later this year. Montreal and Calgary, however, would not reach this threshold until sometime in the 2030s.
Figure 7: Length of time to achieve a price-income ratio of 5, assuming no change in nominal home prices and annual nominal wage growth of 3% per year
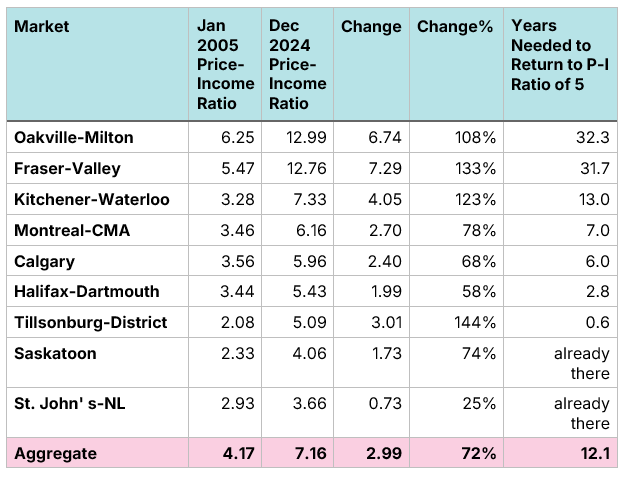
Sources: Author’s Calculation.
In summary, Sabrina is right. Achieving affordability for middle-class families will require prices to go down, at least in some markets
There are some places in Canada, including big markets like Winnipeg and Edmonton, where homes are either affordable or could achieve affordability in a reasonable amount of time with rising wages and flat home prices. However, this is not the case for British Columbia and Ontario (excluding Northern Ontario), where prices have completed detached from incomes that there is simply no way to achieve affordability without falling home prices. And the problem is not isolated to those two provinces, as Calgary, Montreal, and Halifax have high price-to-income ratios, and even affordable Canadian markets are not nearly as affordable as they used to be.
Price declines, however, should not be considered unthinkable. In some markets, prices have decreased significantly since their 2022 peak. Achieving affordability will require further declines.
Figure 8: Single-family home prices by market
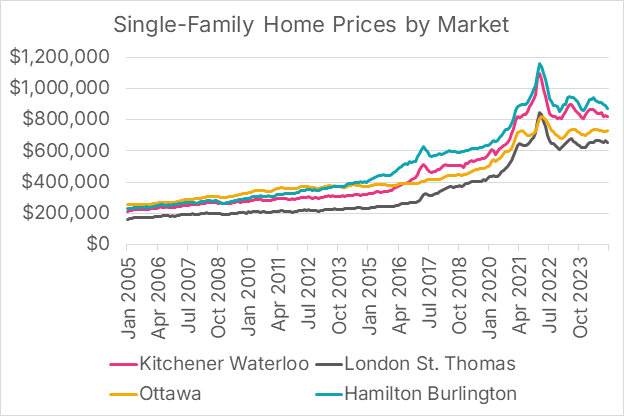
Source: Canadian Real Estate Association data portal
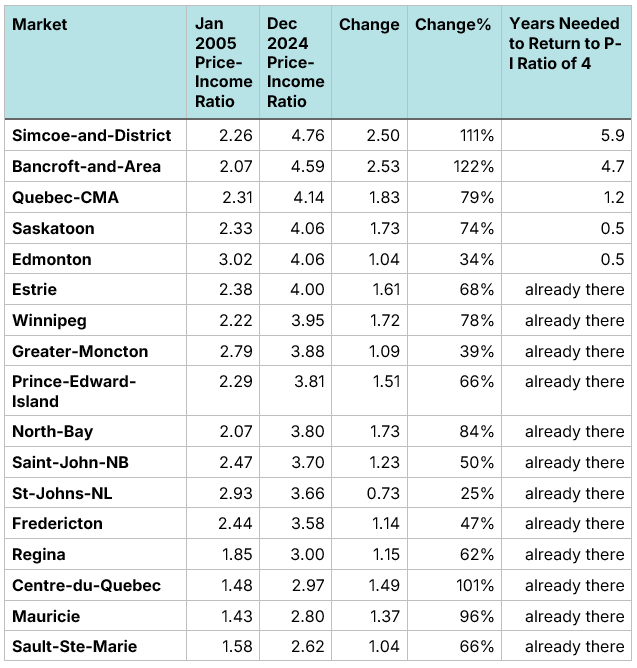
Finally, for completeness, here is how long it would take every housing market in Canada to achieve a price-to-income ratio of 4, assuming annual nominal wage growth of 3% per year, no change to mortgage rates, and flat nominal home prices.
Figure 9a: Length of time to achieve a price-income ratio of 4, assuming no change in nominal home prices and annual nominal wage growth of 3% per year

Figure 9b: Length of time to achieve a price-income ratio of 4, assuming no change in nominal home prices and annual nominal wage growth of 3% per year
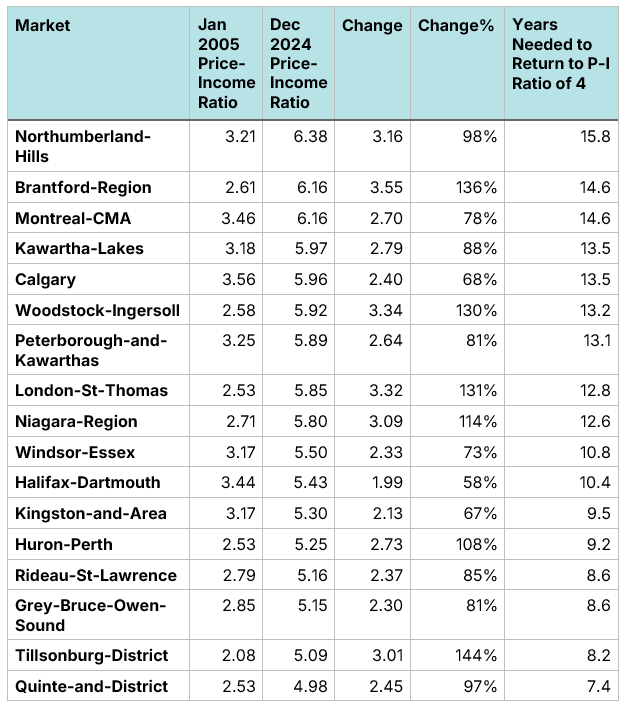
Figure 9c: Length of time to achieve a price-income ratio of 4, assuming no change in nominal home prices and annual nominal wage growth of 3% per year
Download a PDF version of this article below: