


Highlights
Canadian urbanism has a family problem: despite decades of anti-sprawl policy and record transit spending, families and young workers are increasingly leaving major metros for smaller communities where housing is attainable, even if that means longer commutes and more car dependency.
Since 2016, Canada’s metros have experienced sustained net domestic outmigration, with roughly 60,000 more people leaving metros than moving into them last year, a trend that began well before the pandemic.
The people leaving are not primarily retirees heading to cottage country. The biggest losses are among Canadians under 35 and families with young children, precisely the demographic groups our cities once attracted and retained.
Toronto, Montréal, and Vancouver continue to dominate the outmigration story, collectively losing more than 120,000 people through domestic migration last year alone. Meanwhile, smaller metros and rural communities across Ontario, Quebec, Nova Scotia, and Alberta are seeing significant gains from domestic migration.
Many of the communities losing the most ground are the very places planners and urbanists often celebrate as “success stories” in combating sprawl. Families are voting with their feet, and the data suggest current urban planning approaches are failing to deliver affordable, family-friendly, transit-supportive communities at scale.
When families vote with their feet
Canadian urbanism has a problem. Despite, or perhaps because of, the changing nature of our cities, families are increasingly voting with their feet and moving to smaller communities. Despite record transit investments, Canadians are increasingly moving to places where driving is the only option. And it is not just Canada’s biggest metros experiencing outmigration; the so-called urbanist success story of Kitchener-Waterloo is, too.
Urbanism is failing in Canada, and a two-decade-long effort to reduce sprawl through policies such as urban growth boundaries has caused sprawl to accelerate due to the leapfrogging effect, in which development is pushed out to smaller communities without transit, leaving middle-class workers facing long daily commutes back to the metros where their jobs are located.
Here is how Canadian families are voting with their feet and leaving our cities.
Defining our terms
For this piece, we’ll be examining metro areas, not municipalities. So think of the Greater Toronto Area, not the City of Toronto. Statistics Canada divides regions into three types: census metropolitan areas (CMAs), census agglomerations (CAs) and more rural or remote areas that are not in a CMA or CA, based on the following formula:
A census metropolitan area (CMA) or a census agglomeration (CA) is formed by one or more adjacent municipalities centred on a population centre (known as the core). A CMA must have a total population of at least 100,000, based on data from the current Census of Population Program, of which 50,000 or more must live in the core based on adjusted data from the previous Census of Population Program. A CA must have a core population of at least 10,000 also based on data from the previous Census of Population Program. To be included in the CMA or CA, other adjacent municipalities must have a high degree of integration with the core, as measured by commuting flows derived from data on place of work from the previous Census Program.
Currently, there are 41 different CMAs and 111 different CAs in Canada. As of 2025, 31 million people live in a Canadian CMA, 4 million live in a CA, and 6.3 million live outside of a CMA and CA.
Families are leaving our metros
Given that the majority of Canadians live in a metro (CMA), it would be reasonable to assume that these communities are gaining population from the other two regions. And for most of Canadian history, that has been the case. However, since 2015, Canadian CMAs are experiencing net outmigration to other communities in Canada.
Statistics Canada’s Table 17-10-0149-01 provides data on net interprovincial and intraprovincial migration by CMA and CA. It tells us the net number of people who moved into a metro from another part of Canada. If more people moved in from domestic sources than moved out, the figure is positive; if more people left, the figure is negative.
The data is by year, from July 1 to June 30.
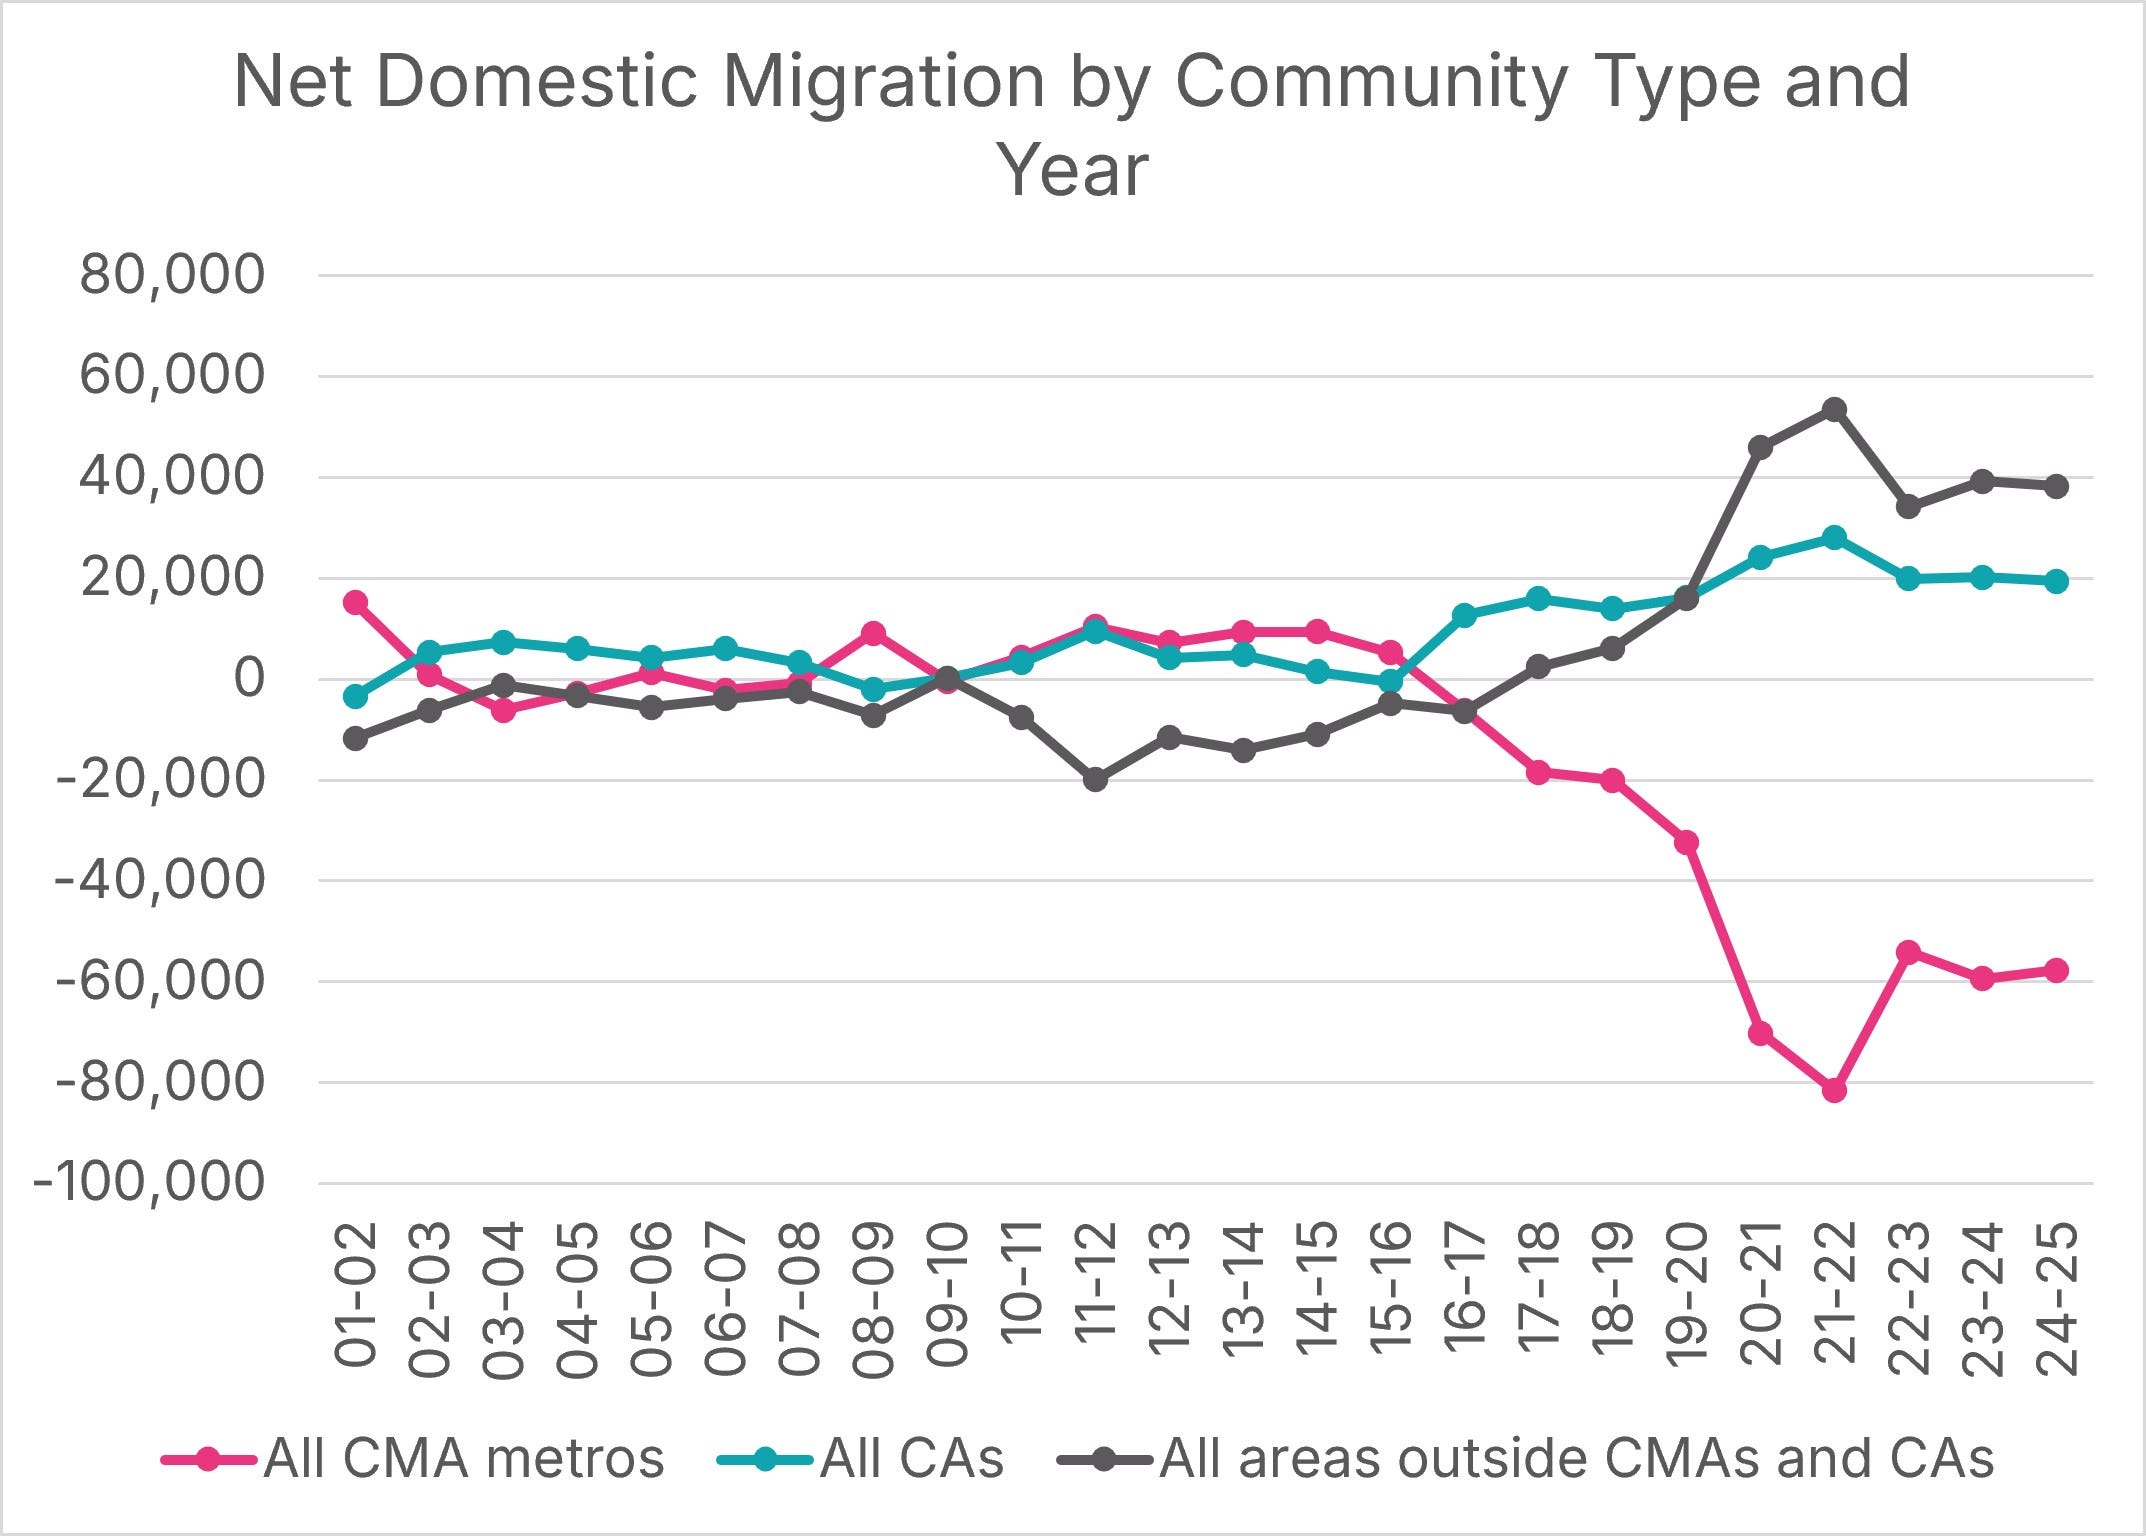
In Figure 1, we see that net migration to CMAs turned negative in 2016-17 and has been negative ever since. In Canada last year, 60,000 more people moved out of Canadian metros than moved in.
Figure 1: Net Domestic Migration by Community Type and Year, Number of Persons
Data Source: Statistics Canada’s Table 17-10-0149-01, Chart Source: MMI.
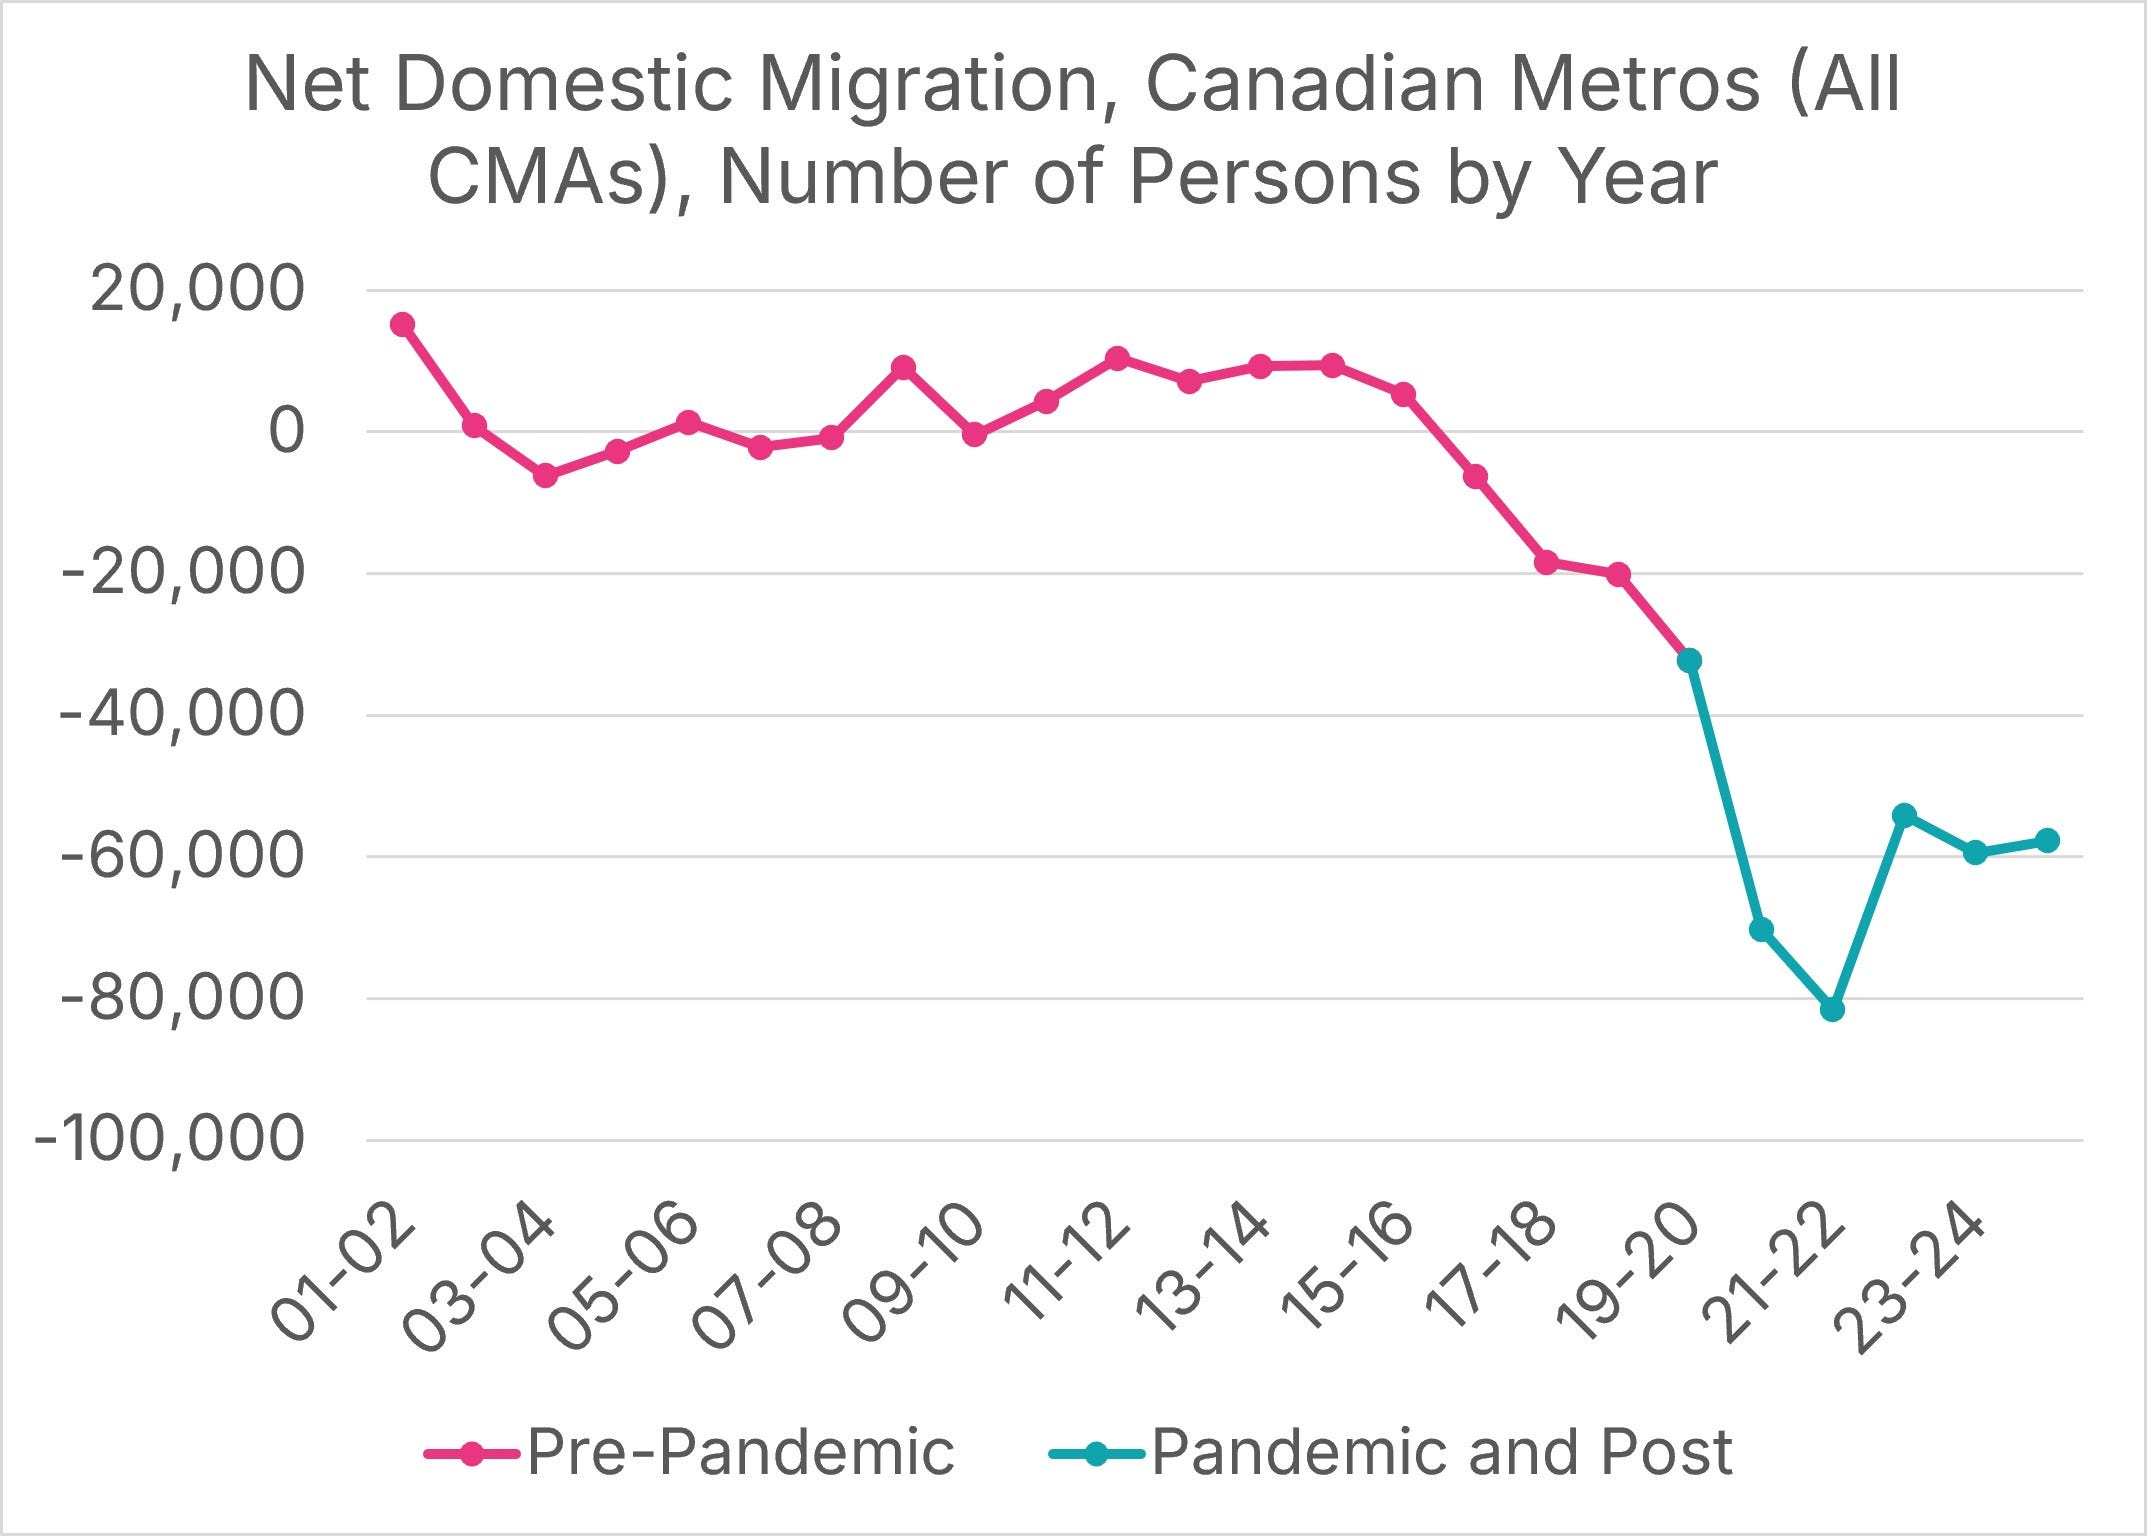
While the pandemic naturally accelerated these trends, this is not simply a pandemic effect, as the phenomenon pre-dates the pandemic by several years, as shown in Figure 2.
Figure 2: Net Domestic Migration in CMAs by Year, Number of Persons
Data Source: Statistics Canada’s Table 17-10-0149-01, Chart Source: MMI.
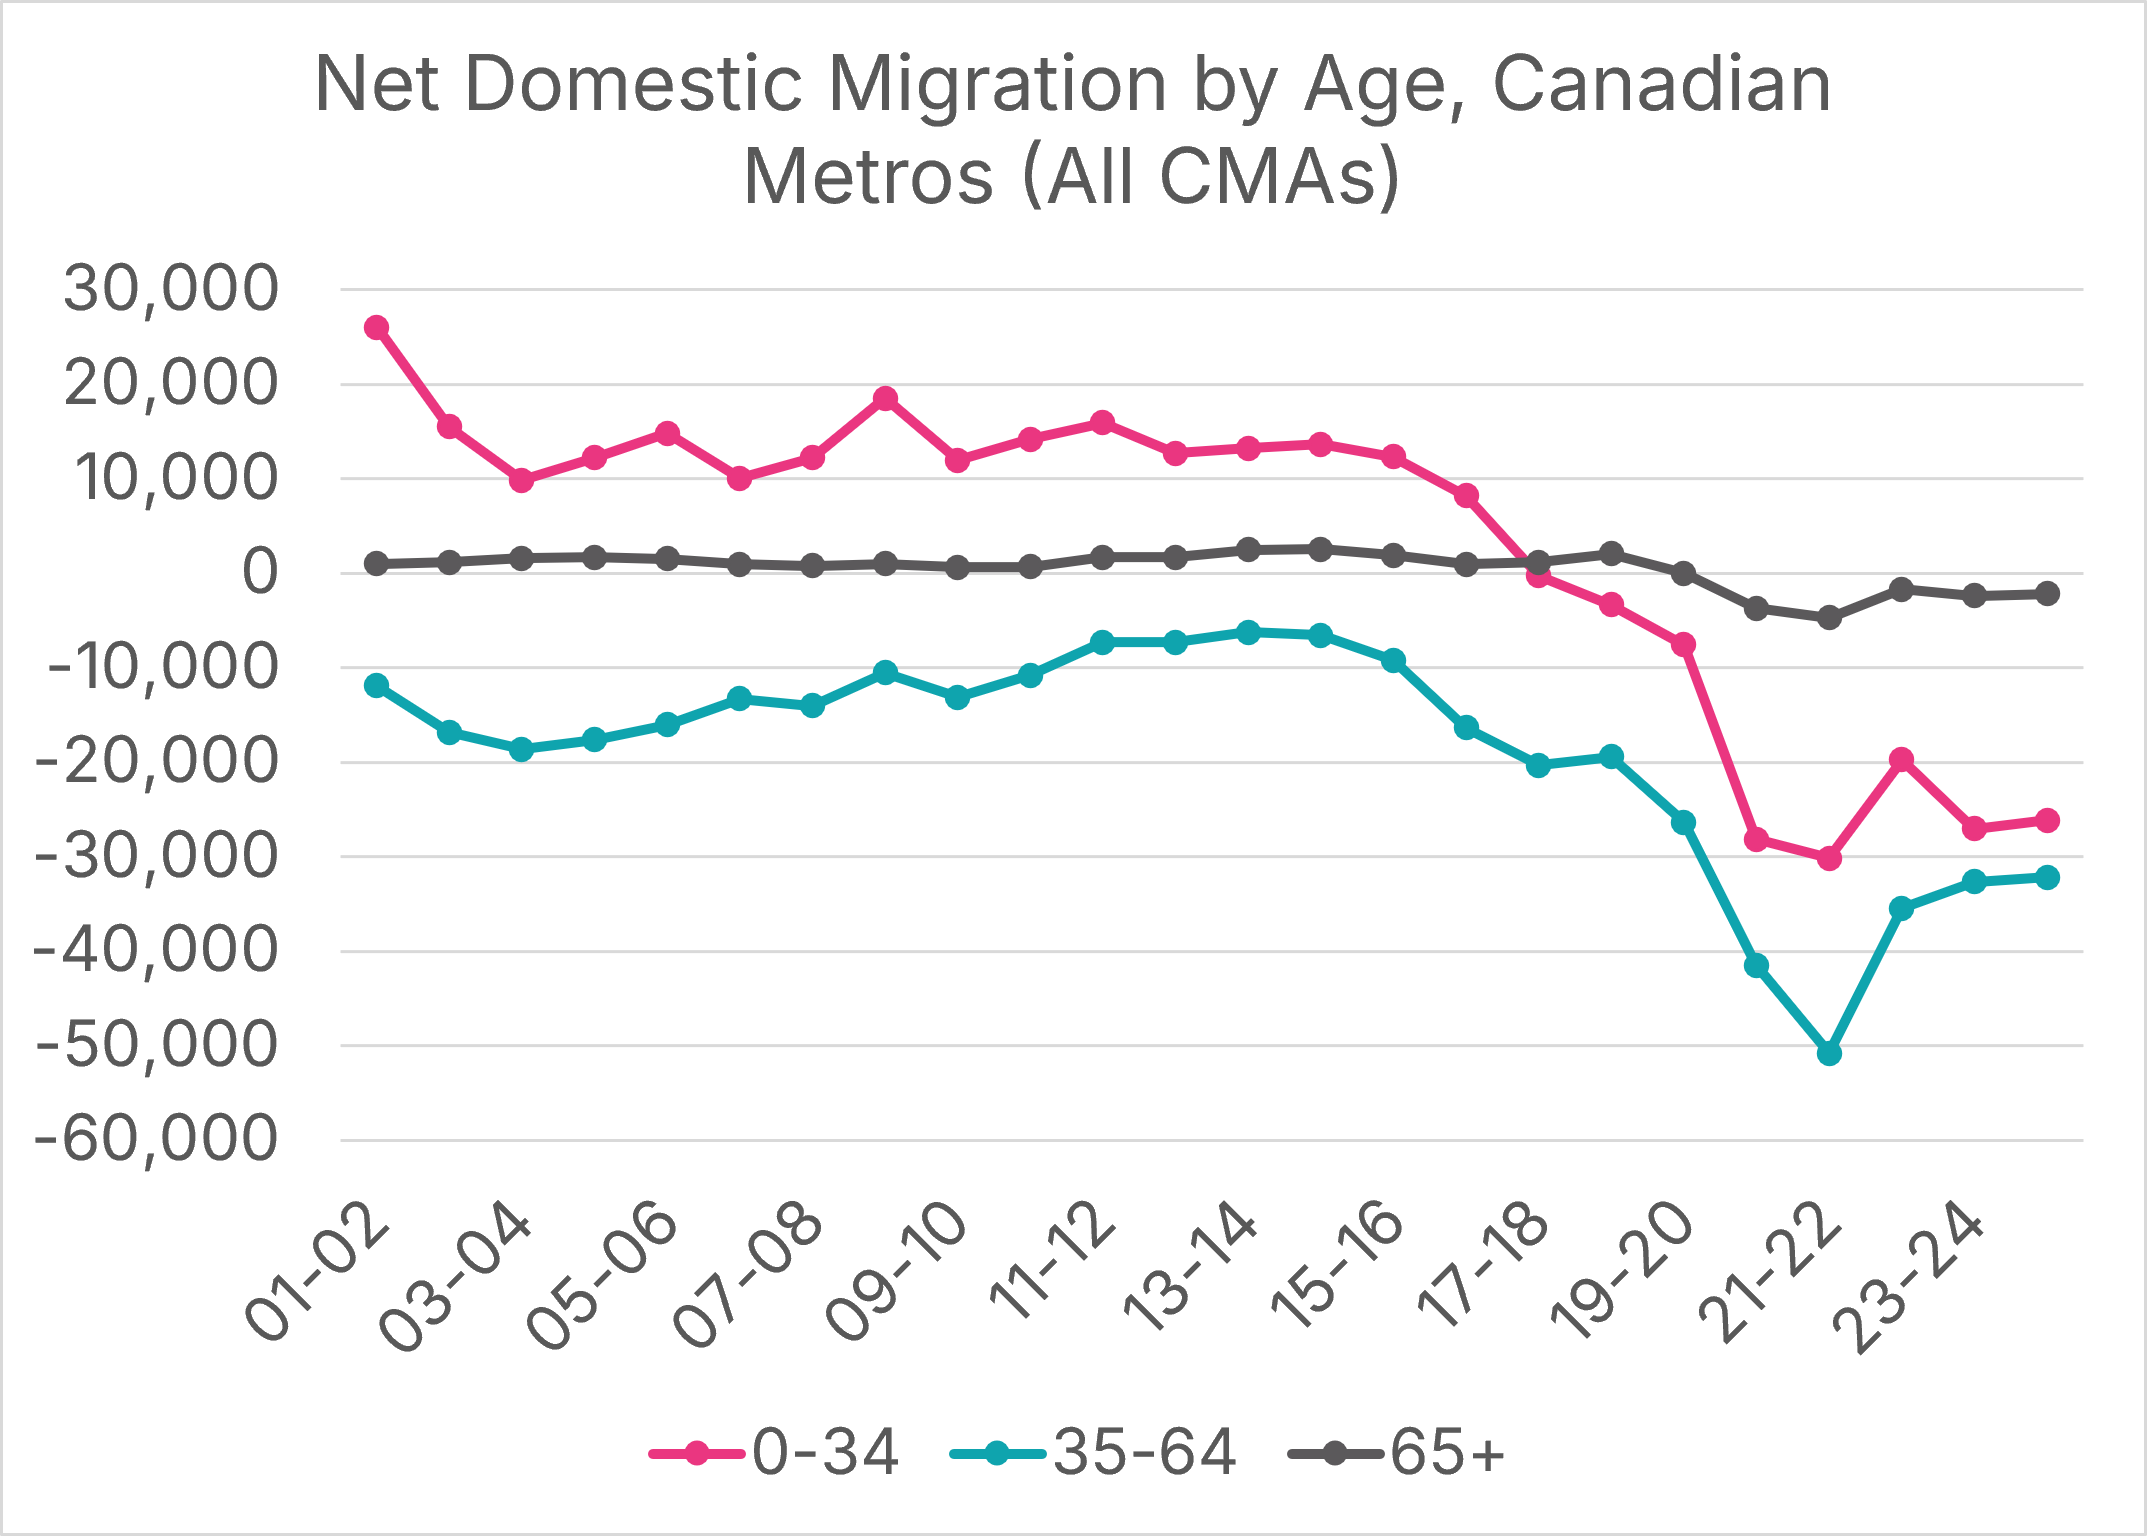
This phenomenon is not due to retirees selling their expensive homes in downtown Toronto and moving to cottage country, though some of that happens. Rather, it is due to the outmigration of those under age 65. A particularly worrisome trend is the outmigration of people under 35. It used to be that our metros were places that our ambitious young people moved to. Now they are places they move from.
Figure 3: Net Domestic Migration in CMAs by Age, Number of Persons, July 1, 2024 to June 30, 2025
Data Source: Statistics Canada’s Table 17-10-0149-01, Chart Source: MMI.
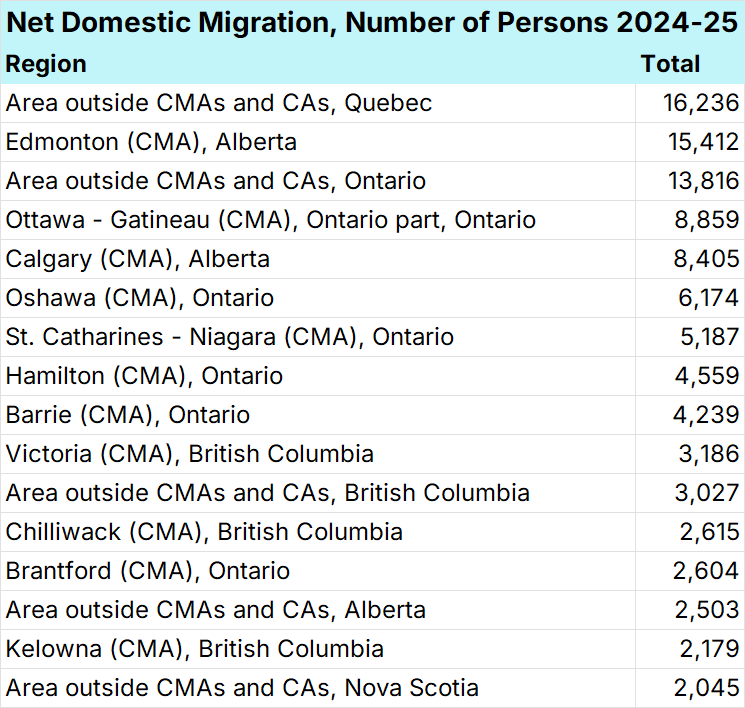
Aggregating all 41 CMAs like this obscures the fact that most metros are, in fact, gaining population from the rest of Canada. According to Statistics Canada data, 16 places gained more than 2,000 persons through domestic migration last year, as shown in Figure 4. This includes rural and remote parts of Quebec, Ontario, British Columbia, and Nova Scotia. The other 11 were all metros, including the large metros of Edmonton, Ottawa, and Calgary. In Ottawa CMA’s case, most of this growth is occurring outside of the City of Ottawa, as we outlined in our feature on Lanark County.
Figure 4: Net Domestic Migration by Community, Number of Persons, July 1, 2024 to June 30, 2025
Data Source: Statistics Canada’s Table 17-10-0149-01, Chart Source: MMI.
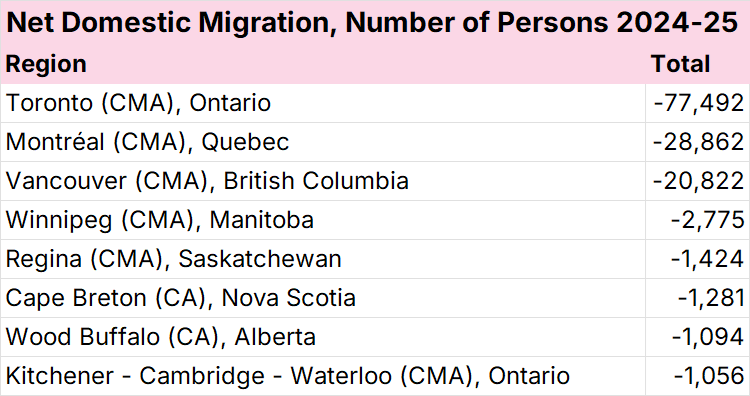
Conversely, eight communities lost more than 1,000 people through net domestic migration, with the Toronto, Montréal, and Vancouver metros collectively losing over 120,000 people. Winnipeg, Regina, and Kitchener-Cambridge-Waterloo also lost over 1,000 persons through net domestic migration last year.
Figure 5: Net Domestic Migration by Community Type, Number of Persons, July 1, 2024 to June 30, 2025
Data Source: Statistics Canada’s Table 17-10-0149-01, Chart Source: MMI.
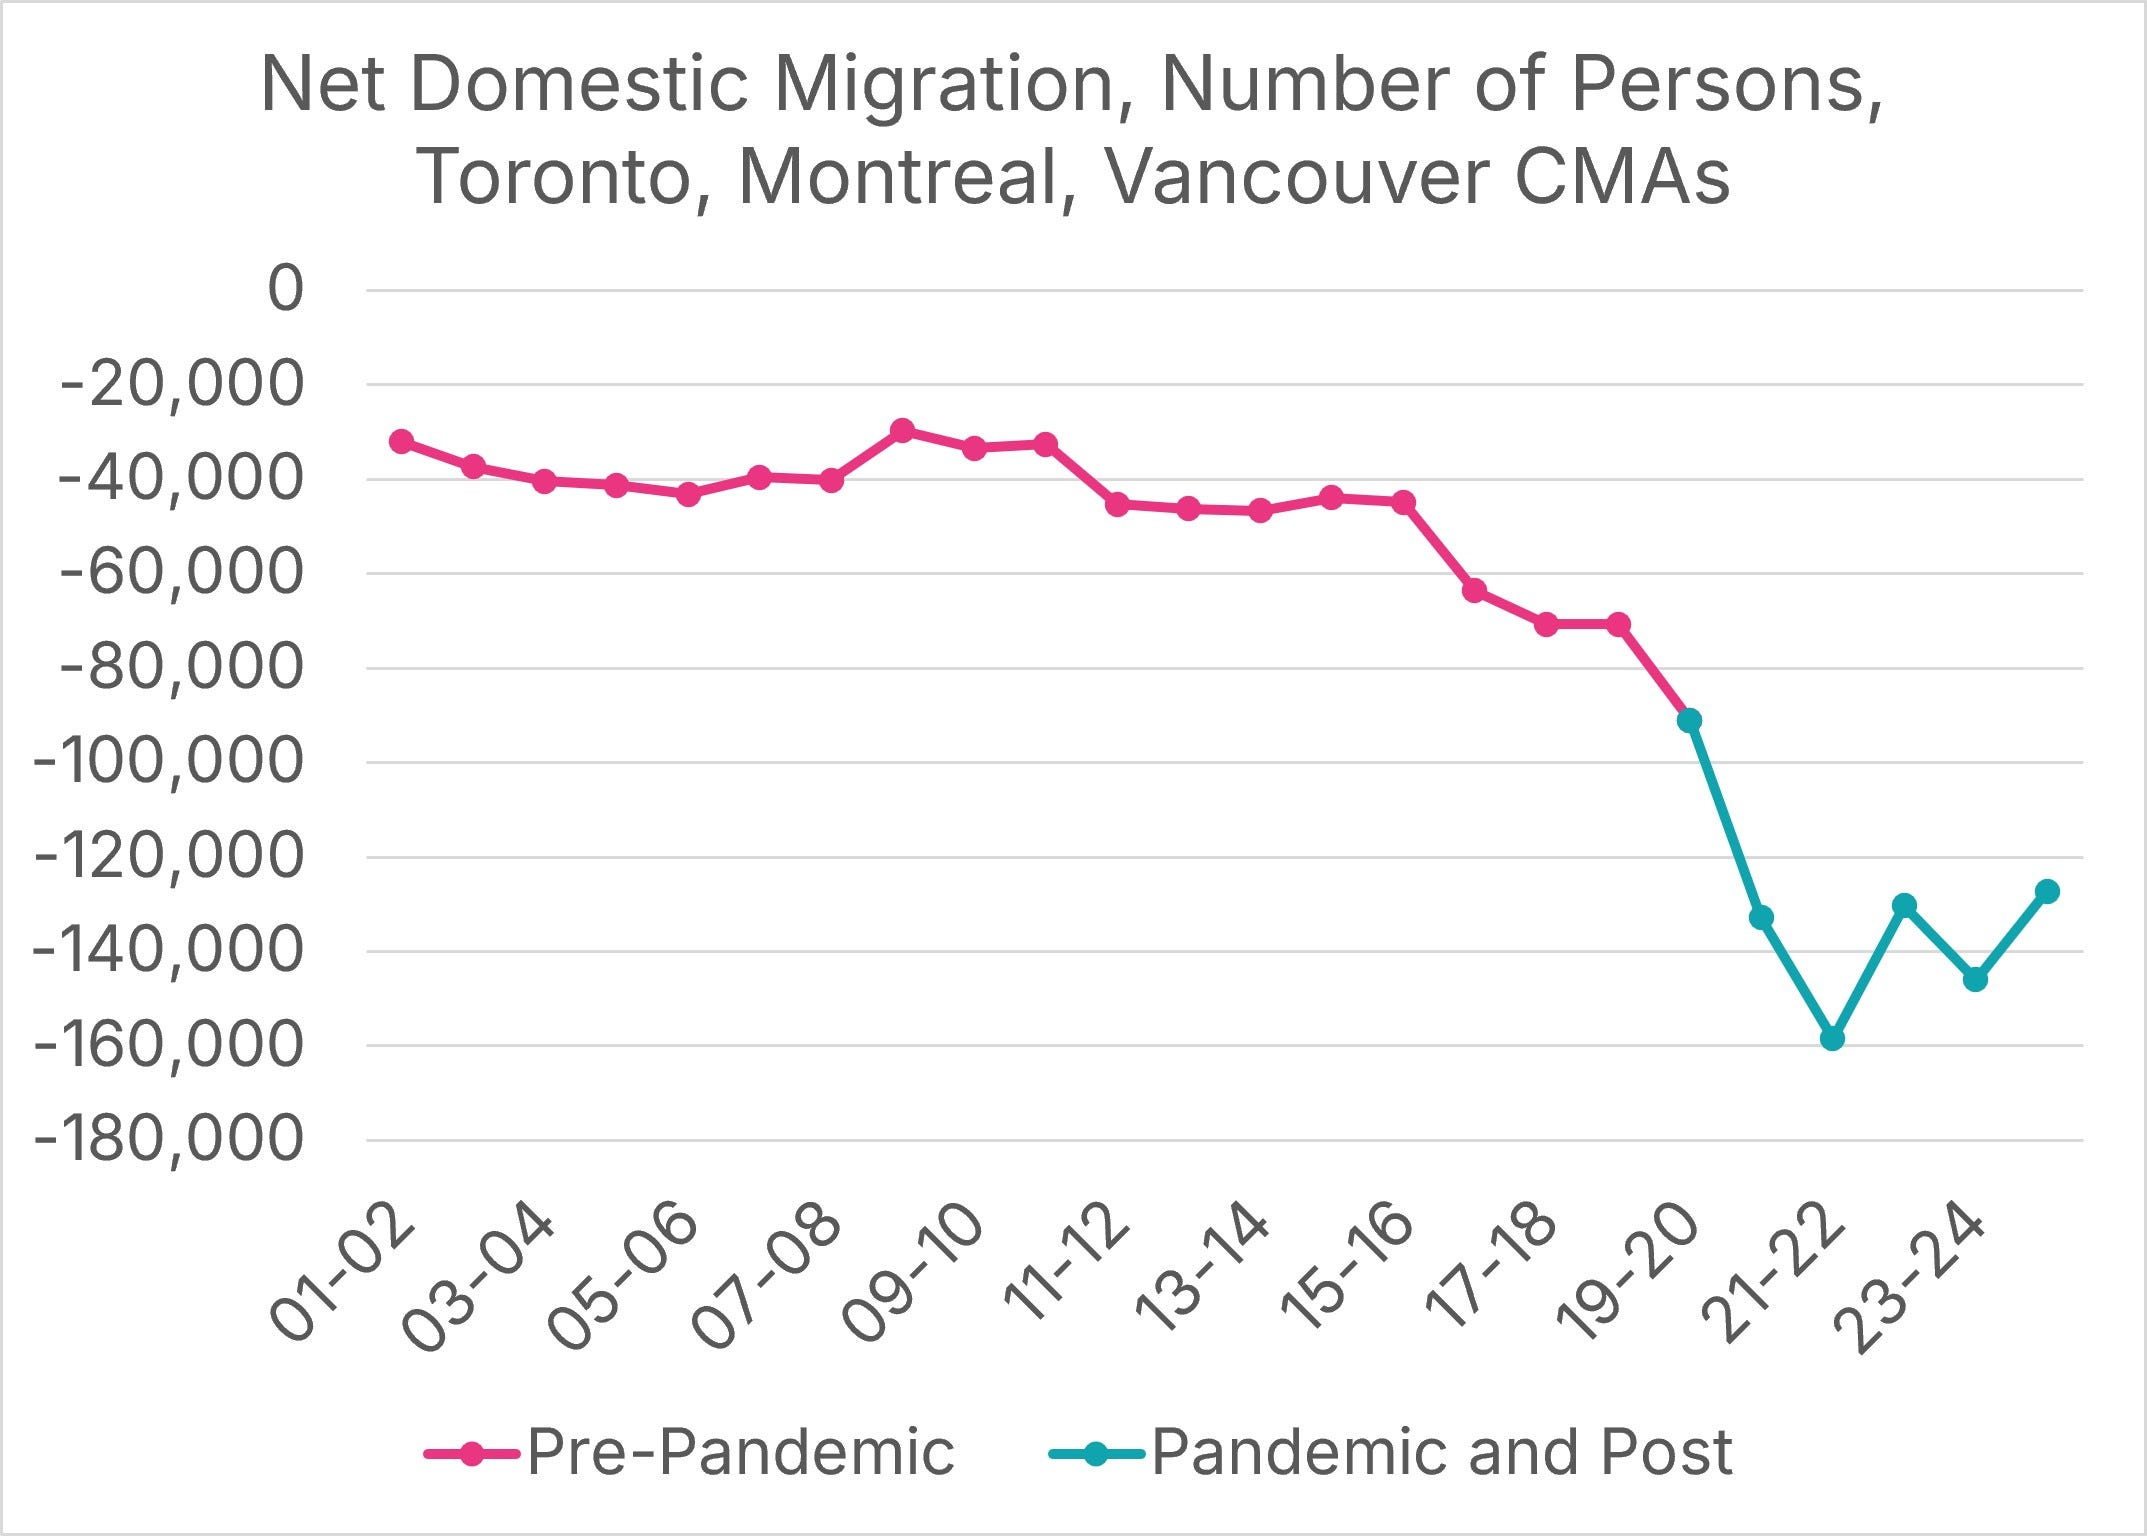
Our three largest metros have lost population due to domestic migration each year this century, though the declines accelerated in 2015-16. Net outmigration peaked in 2021-22 at 160,000 persons and currently stands at 120,000 persons per year, well above pre-pandemic levels.
Figure 6: Net Domestic Migration in Toronto, Montréal, and Vancouver CMAs by Year, Number of Persons
Data Source: Statistics Canada’s Table 17-10-0149-01, Chart Source: MMI.
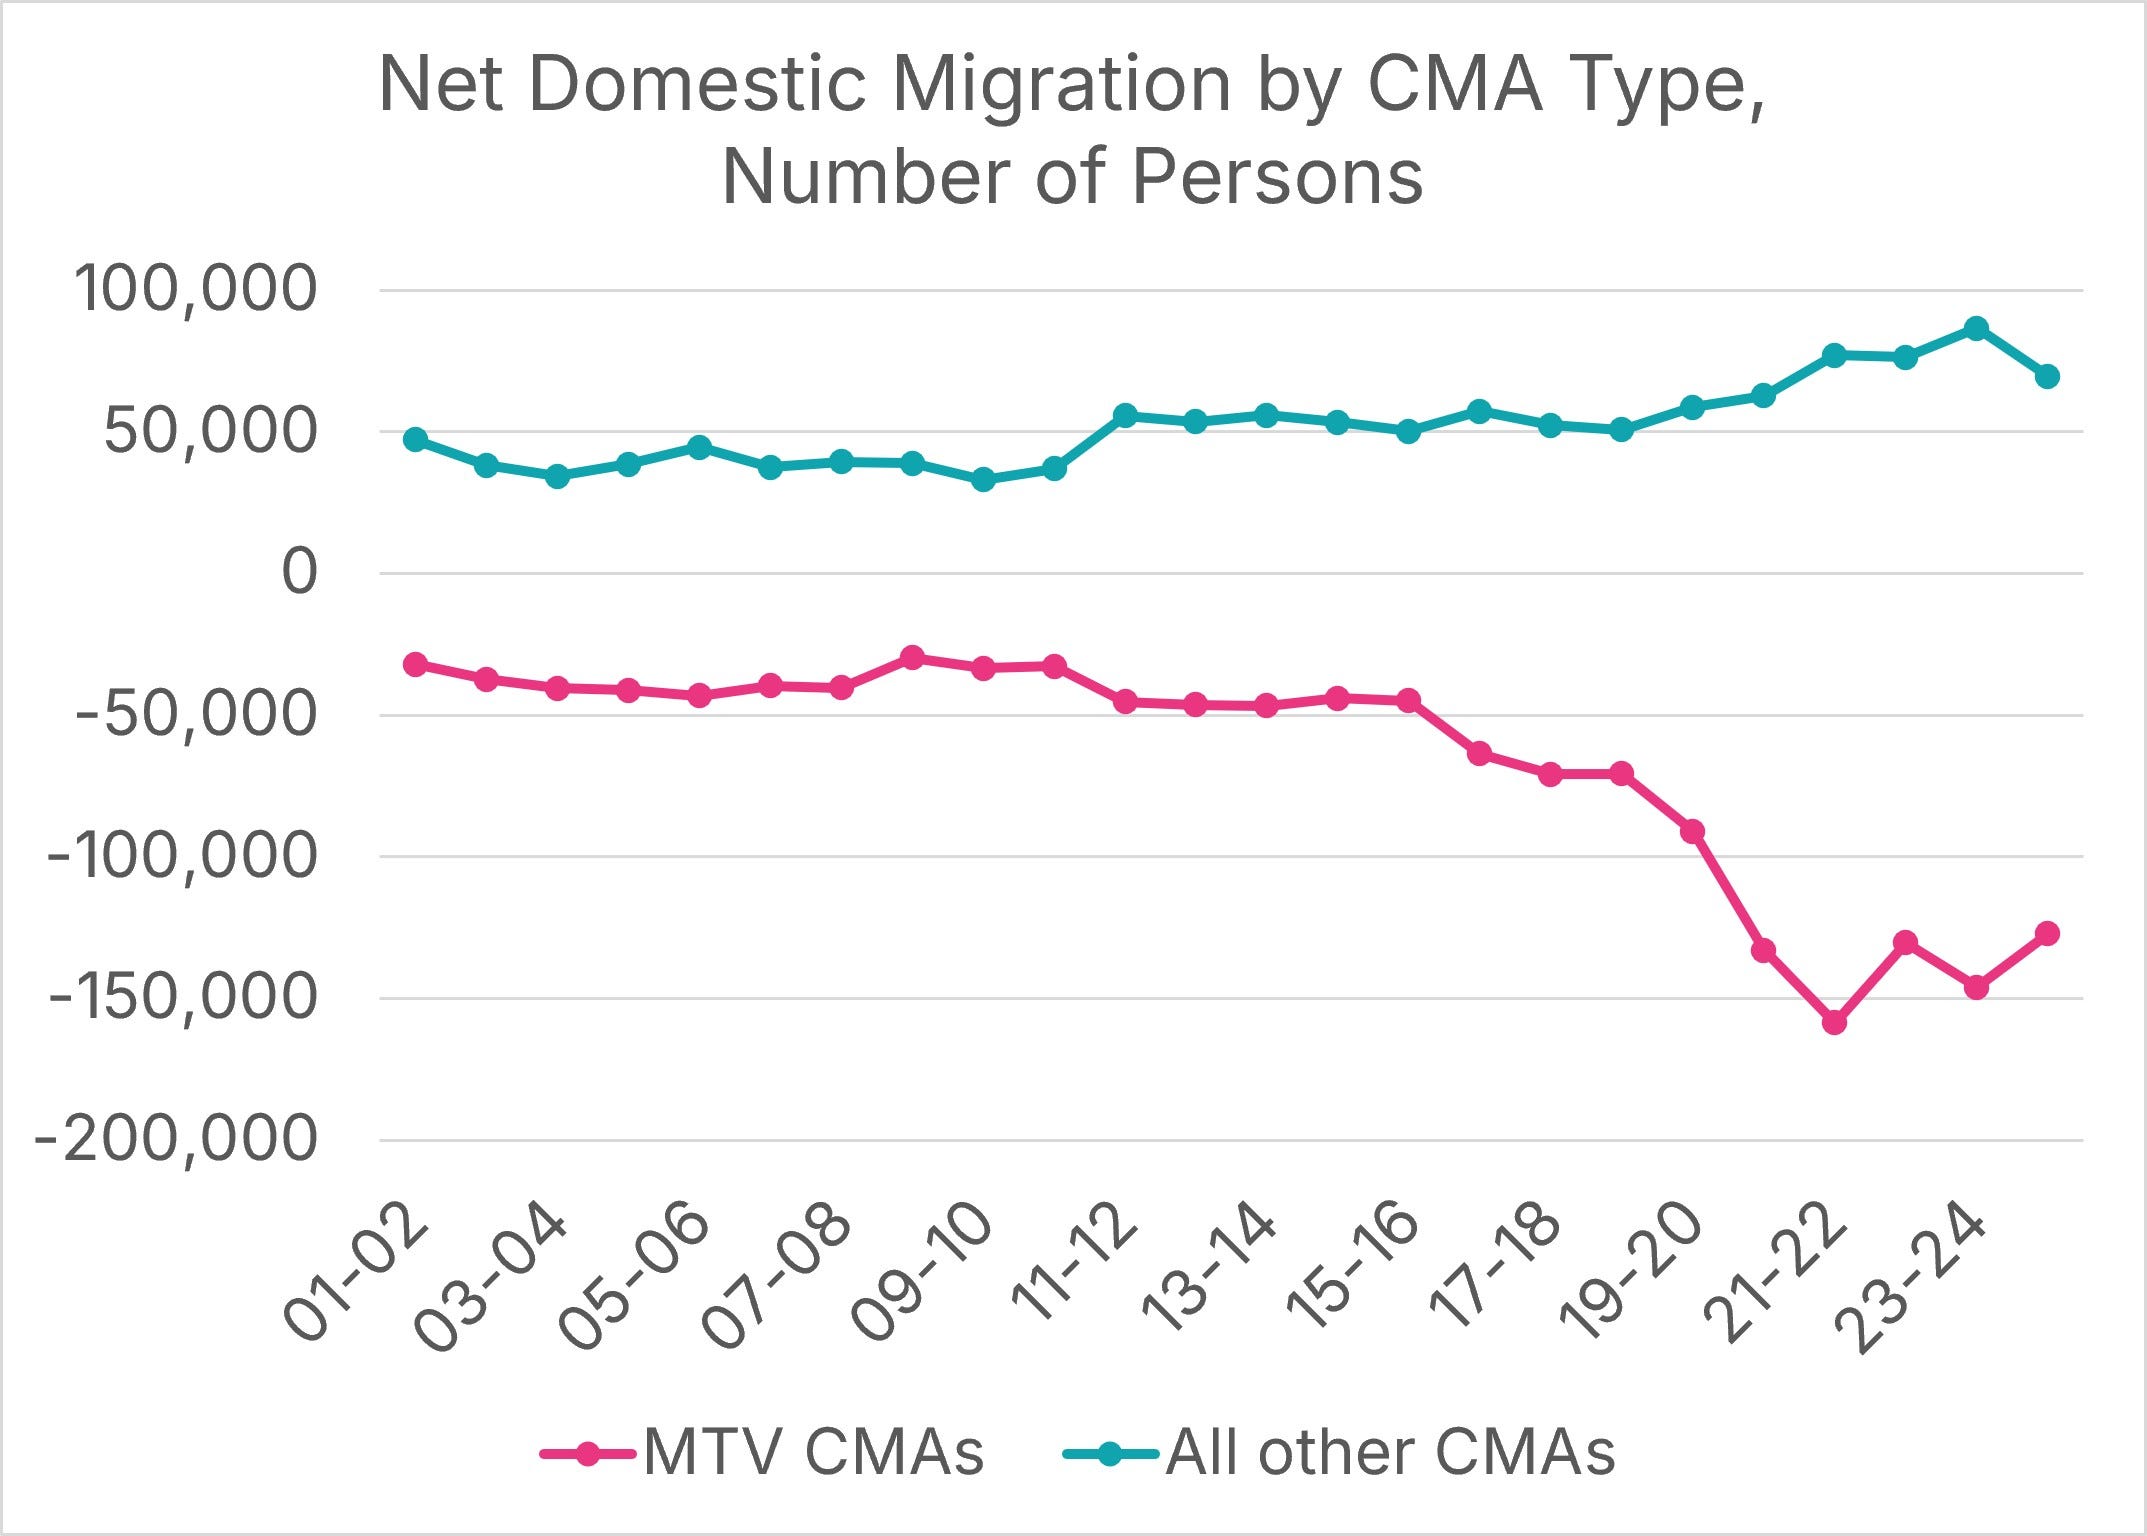
This domestic metro out-migration largely, but not exclusively, is an MTV (Montréal, Toronto and Vancouver) problem, as collectively, the other 38 CMAs experienced steady in-migration during the 2010s, which increased during the pandemic.
Figure 7: Net Domestic Migration by CMA Type and Year, Number of Persons
Data Source: Statistics Canada’s Table 17-10-0149-01, Chart Source: MMI.
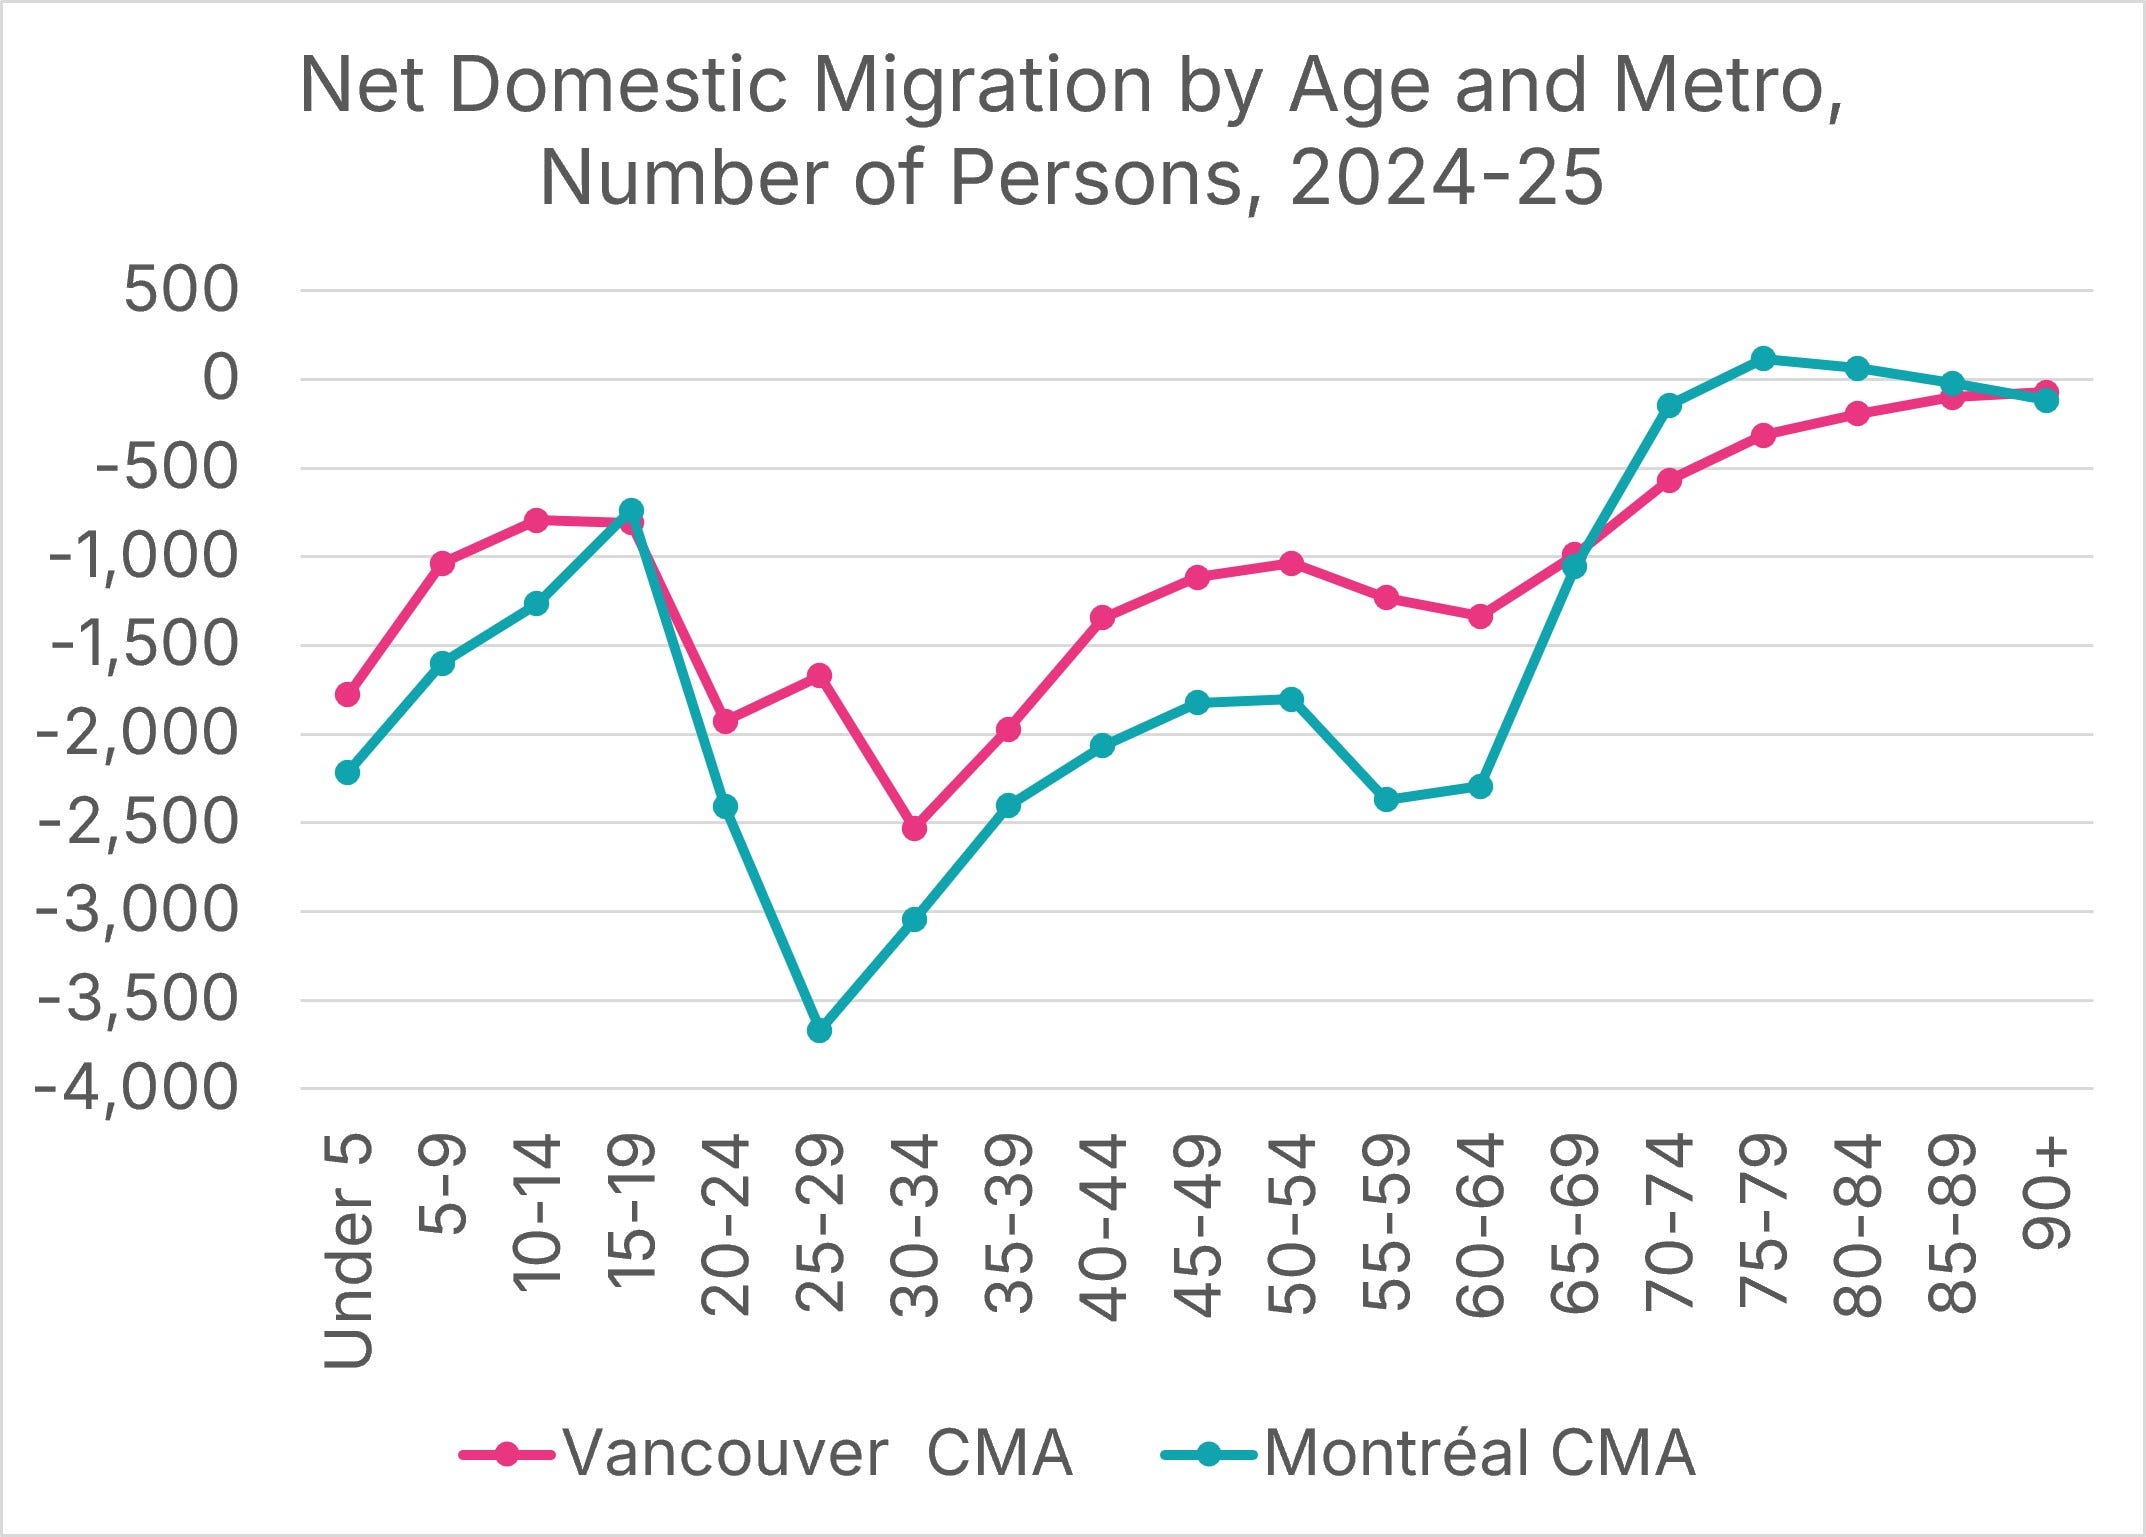
We can get a better idea of who is leaving by breaking the data down into five-year age categories. Because net outmigration in Toronto CMA is substantially higher than in Montréal and Vancouver CMAs, we will use two different charts. The largest domestic outmigration in Montréal CMA is among people aged 25 to 29, whereas in Vancouver it is among those aged 30 to 34. In general, early-career workers and young children are the most likely to leave these metros, though Montréal also experiences a fair level of outmigration among those aged 55 through 64.
Figure 8: Net Domestic Migration by Age, Number of Persons, Vancouver and Montreal CMAs
Data Source: Statistics Canada’s Table 17-10-0149-01, Chart Source: MMI.
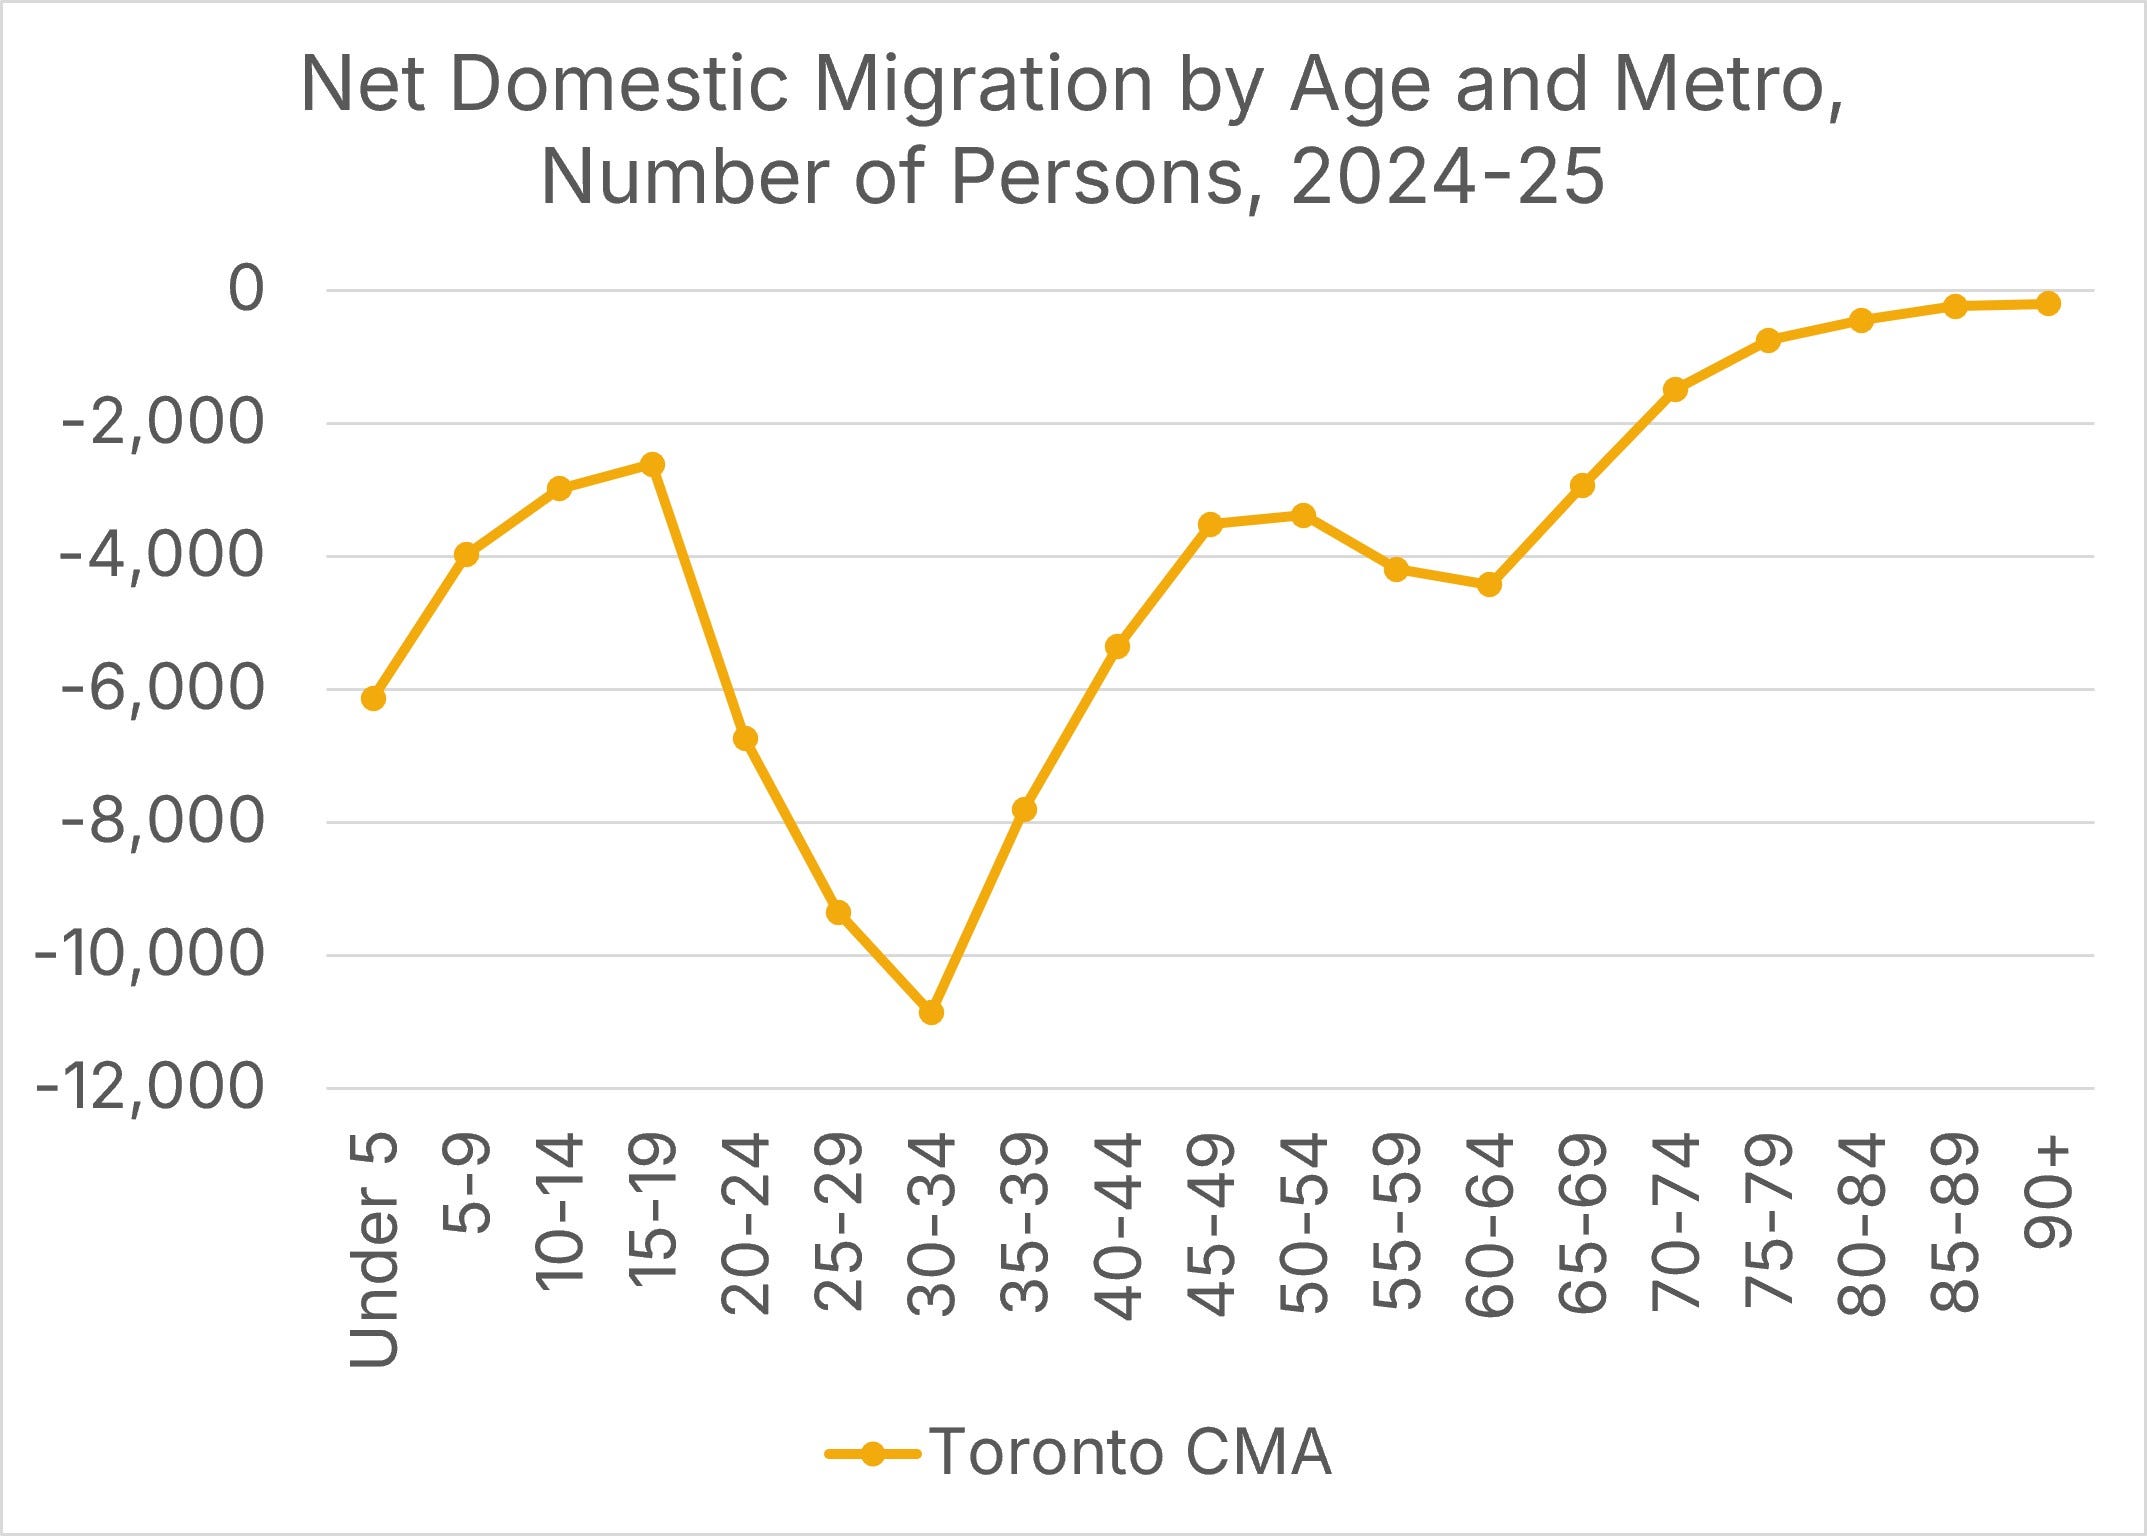
The trends for the Toronto CMA are quite similar, with young children and early-career workers most likely to move to other communities. It is important to remember that this data is for the Greater Toronto Area, not the City of Toronto, so it includes municipalities such as Oakville, Markham, and Brampton. As with Montréal, the data show a cohort of people in their late 50s and early 60s leaving the metro, but the numbers are relatively modest compared to the exodus of workers under 40 and children under 5.
Figure 9: Net Domestic Migration by Age, Number of Persons, Toronto CMAs
Data Source: Statistics Canada’s Table 17-10-0149-01, Chart Source: MMI.
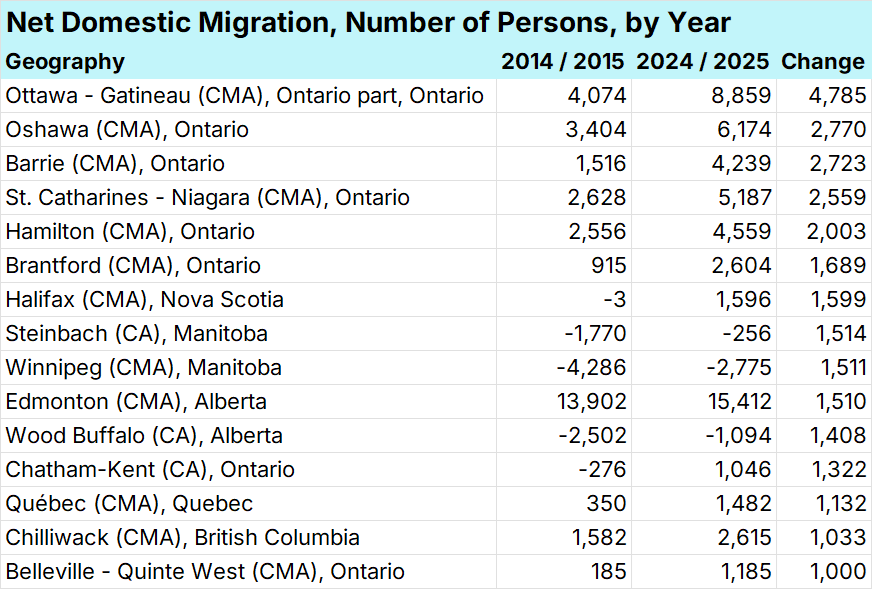
To get an idea of how these patterns have changed over time, we can examine the levels of net domestic migration experienced by a CMA and a CA relative to ten years ago. Figure 10 contains every CMA and CA that gained 1,000 more people through domestic migration than they did a decade ago. The top of the list is dominated by the GTA-proximate metros of Oshawa, Barrie, St. Catharines-Niagara, Hamilton, and Brantford, with Kitchener-Cambridge-Waterloo and Guelph as notable omissions.
Figure 10: Change in Net Domestic Migration by CMA and CA, Number of Persons, 2014-15 vs. 2024-25
Data Source: Statistics Canada’s Table 17-10-0149-01, Chart Source: MMI.
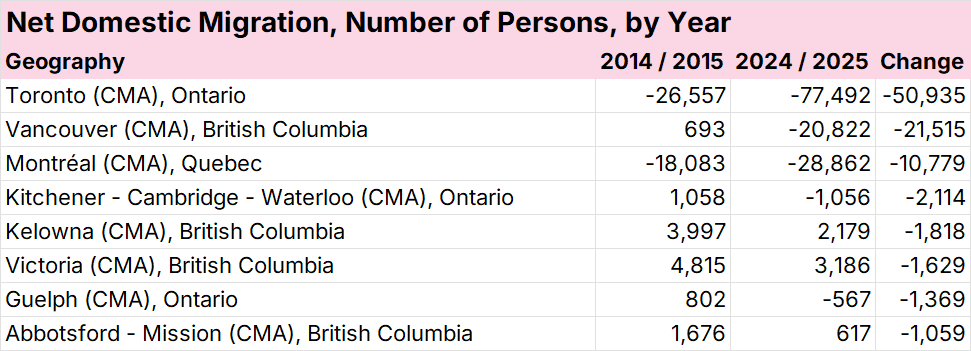
In Figure 11, we show the communities that have seen their net domestic migration drop by 1,000 or more persons.
Other than the big three metros, the list exclusively contains communities in Ontario and British Columbia, and not just any communities in these provinces, but ones that urbanists and municipal planners often cite as success stories in fighting sprawl and creating livable, urban communities. Yet families are voting with their feet and moving out of these places or moving to them at lower rates than a decade ago.
Figure 11: Change in Net Domestic Migration by CMA and CA, Number of Persons, 2014-15 vs. 2024-25
Data Source: Statistics Canada’s Table 17-10-0149-01, Chart Source: MMI.
In short, if governments want to fight sprawl and create walkable, family-friendly communities with transit options, they need to examine their policies and determine what works and what doesn’t. Families are voting with their feet and moving out of the very communities urbanists and planners suggest those families want.
If that’s not failure, we’re not sure what is.