

Case Study: Migration to Lanark County Through New Family-Friendly Housing
When planners underestimate migration, families find their own solutions in places like Lanark

Highlights
Lanark Census Division is growing rapidly due to an influx of new families: Lanark has become a leading destination for families seeking affordable, three-bedroom homes. Its intraprovincial in-migration rate is ten times higher than Ottawa’s: 20 persons per 1,000 residents each year, compared to 2 in the City of Ottawa. Builders who sell identical units in Lanark and the City of Ottawa charge $200,000 less for the Lanark home, despite using the same materials and labour, due to lower development charges, lower land costs, and faster approvals.
The City of Ottawa faces a significant gap in ground-oriented housing: The city needs approximately 205,000 new ground-oriented homes by 2051, but is on track to build only about 120,000 at current rates, leaving the city more than 80,000 short, even before accounting for additional migration from the GTA. This undersupply will lead to more families moving to communities such as those in Lanark.
Population forecasts underestimate Eastern Ontario’s growth: Ontario’s Ministry of Finance projections assume migration between regions will slow, undercounting future population growth in Lanark as well as other surrounding areas, while overestimating the GTA’s share of future population gains. Lanark County can plan properly to accommodate this undersupply and welcome new neighbours while growing its tax base.
Families follow housing, not projections: Without a major shift in how Ottawa and Queen’s Park plan for and permit family-sized, ground-oriented housing, outmigration to communities like Lanark will intensify, redrawing the geography of Ontario’s middle class.
Lanark is a prime destination for families, particularly families with children
One of the major themes of our recent Families on the Move: 670,000 More Households in Eastern Ontario by 2051 report is that families will move to smaller communities, such as those in Lanark County, because they can create affordable housing. High-quality, lower-cost homes and communities attract families, particularly those from the GTA, as communities struggle to build enough larger homes (3 bedrooms or more) to support future population growth and demographic change, which will cause an increasing number of families to move to surrounding areas.
Policymakers need to account for families’ housing demand and recognize that the trend of families with children moving to smaller communities is not going away. However, this migration is not accounted for in population projections, resulting in the GTA’s future population being overestimated and the growth of places like Lanark being underestimated.
The communities of Lanark County have become an attractive place for new homebuyers seeking both family-oriented and retiree housing opportunities, blending a high quality of life with affordability and access to nature. It is a case study of how families are moving just outside cities, in this case, the City of Ottawa, to enjoy the conveniences of its larger neighbour at a lower cost of living while embracing a small-town lifestyle.
The following is a case study on how population projections fail to account for demand for attainable, high-quality communities like Lanark.
Lanark and the rest of the Ottawa Region have substantial pre-existing housing shortages
In February, MMI published “Communities are Unprepared for the Exodus of Urban Families,” which used the Lanark Census Division as a case study on population and housing dynamics in the Ottawa Region. Since the publication of the piece, the Missing Middle Initiative released the RoCA Benchmark 3.0 method for estimating future housing needs and housing shortages, and Ontario’s Ministry of Finance ratcheted down population projections across the province, as the federal government lowered immigration targets and reduced the number of non-permanent residents entering the country each year.
Only the first of these changes, the development of the 3.0 version of the RoCA Benchmark model, impacts housing shortage estimates. The revised housing shortage estimates are found in Figure 1 for the Ottawa Region.
Note: Here “Ottawa Region” refers to the City of Ottawa, Prescott and Russell, Leeds and Grenville, Lanark, and Stormont, Dundas and Glengarry Census Divisions.
Figure 1: Estimated housing shortages by type, as of 2021, RoCA Benchmark 3.0 method, five Ottawa-area census divisions
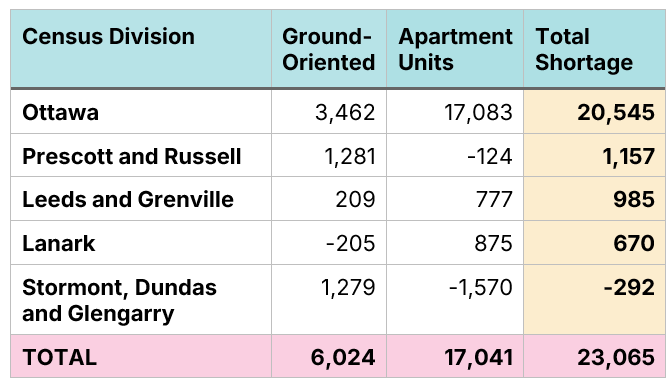
Chart Source: MMI.
The RoCA Benchmark differentiates between apartment units and ground-oriented housing, which is defined as single-detached, semi-detached, and townhouses. This distinction is vitally important, as families with children seek out ground-oriented homes they can own, and the growth of ground-oriented housing is the single best predictor (statistically) of migration of individuals and families from one community in Ontario to another.
Figure 2. Current housing type by family, Census 2021, Ontario

Data Sources: Census 2016, 2021. Calculation and Chart Source: MMI
Municipal planners rarely consider pre-existing housing shortages in their planning, thereby perpetuating them. They do, however, typically account for future population growth and demographic change. The RoCA Benchmark v3.0 provides an estimate of those needs, which can aid in planning.
Lanark and the rest of the Ottawa Region need over 130,000 more apartment units by 2051
Using the RoCA Benchmark 3.0 model and the Ministry of Finance’s population projections through the year 2051, we find that the Ottawa region needs to grow the apartment unit stock by just over 132,000 units a year, of which nearly 119,000 are needed within the City of Ottawa, assuming no change to the rate at which families move in from other parts of Ontario, including the GTA.
Figure 3: Projected apartment unit need, 2021-51, five Ottawa-area census divisions, excluding enhanced intraprovincial migration
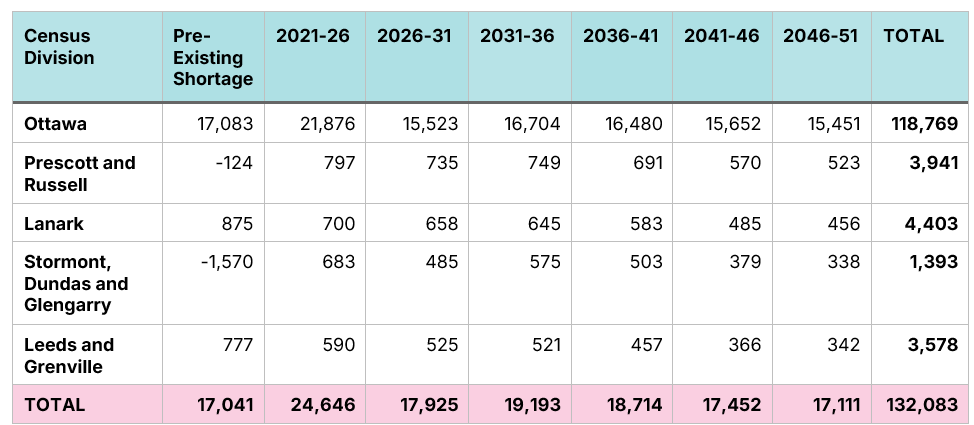
Chart Source: MMI.
Net of demolitions and conversions, this requires a 4,000-unit-per-year increase in the City of Ottawa’s apartment stock. Over the past few years, Ottawa has made progress toward this target, and in 2022 and 2023, it significantly exceeded it.
Figure 4. City of Ottawa Housing Starts by Year and Type of Home

Data Source: CMHC Housing Market Information Portal, Chart Source: MMI.
It is important to note, however, that the apartment needs estimates for the City of Ottawa are substantially higher than what is found in the City of Ottawa’s Growth Projections for the New Official Plan. We find that between 2021 and 2051, the City will need to add 50,000 apartment units. We find that the actual need is over 118,000, which is much closer to recent construction activity.
Note: The City of Ottawa’s growth projections only extend to 2046, and show steadily declining needs from 2021 to 2046. To ensure a fair comparison between the two systems, we take the City’s 2041-46 apartment need projection and replicate it for 2046-51. This is almost certainly an overestimate of what the City would have projected, given that they show need continually falling, rather than staying steady.
Figure 5: Projected apartment unit need, 2021-46, City of Ottawa, our estimate vs. City growth projections
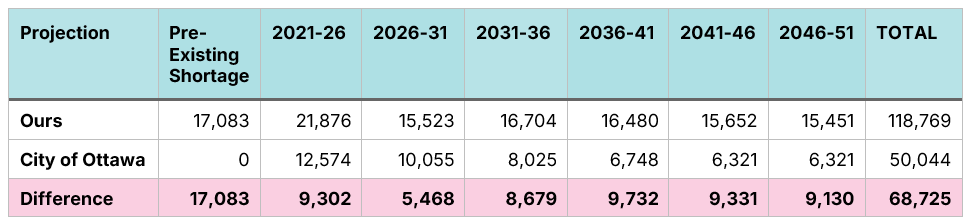
Chart Source: MMI.
Given recent apartment construction levels, the City of Ottawa may be able to build enough apartments despite exceptionally low projections in its growth study. Ground-oriented housing, however, is likely to be far more challenging.
Before accounting for enhanced spillovers from the GTA, the Lanark and the Ottawa Region need 260,000 additional ground-oriented homes
Using the RoCA Benchmark 3.0 model and the Ministry of Finance’s population projections through the year 2051, the Families on the Move report finds that, before accounting for enhanced migration from the GTA, the Ottawa Region will need to increase its supply of ground-oriented housing by over 260,000 units between 2021 and 2051. The five-year breakdown by need and Census division is found in Figure 6.
Figure 6: Projected ground-oriented housing need, 2021-51, five Ottawa-area census divisions, excluding enhanced intraprovincial migration
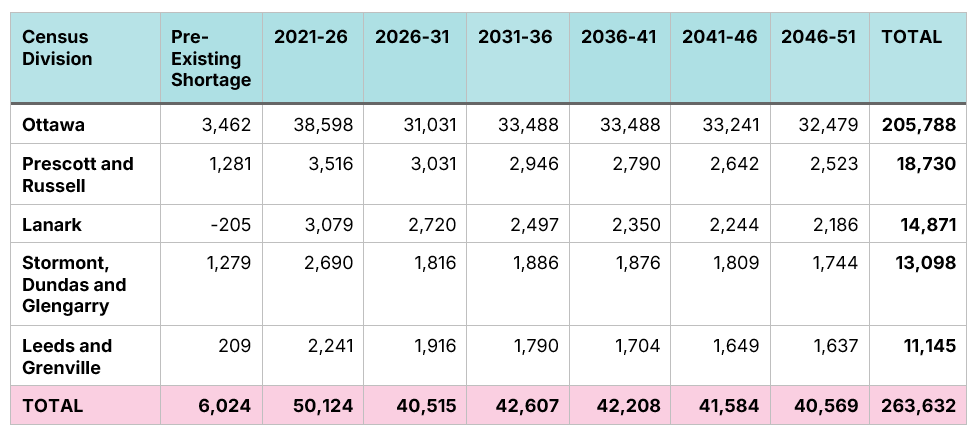
Chart Source: MMI.
However, these estimates are based on the Ministry of Finance’s population projections and, as such, require those estimates to be correct. However, as shown by the Families on the Move report, the Ministry of Finance’s population projections overestimate growth in the GTA and underestimate it in the rest of the province, including the Ottawa Region.
More families will move into Lanark than the Ministry of Finance projects
All of our estimates so far assume that the Ministry of Finance’s population projections will be accurate. However, we believe it is incredibly likely that they are overestimating population growth in the GTA and underestimating it in the Ottawa Region. The piece “Built to Fail: Ontario’s New Housing Methodology Is a Blueprint for Shortages” outlines how the Ministry of Finance assumes that fewer families will move from one Ontario community to another, an untenable assumption given that middle-class families continue to face significant housing shortages in the GTA.
While year-to-year variation in migration numbers is evident, there is an unmistakable trend toward more individuals and families leaving the GTA for other parts of Ontario.
Figure 7: Total net intraprovincial migration by four-year time period, City of Toronto and York, Peel, and Halton Regions, number of persons
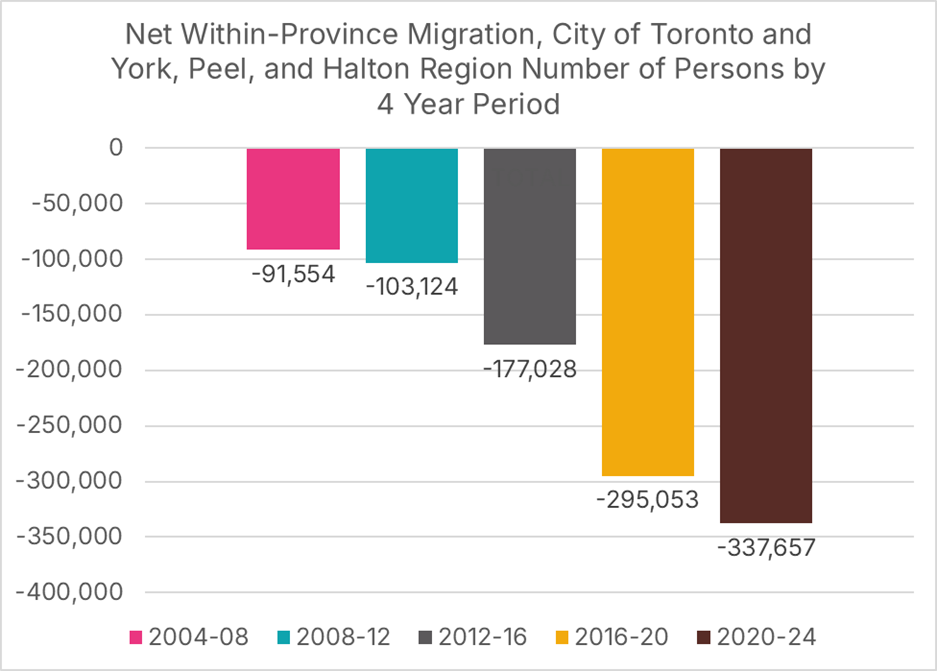
Data Source: Statistics Canada Table 17-10-0153-01, Chart Source: MMI.
Outside of a large, one-time jump in 2016-20, the four Ottawa region census divisions outside of the City of Ottawa have experienced large increases in net intraprovincial in-migration, while the City of Ottawa’s levels have remained relatively stable.\
Figure 8: Total net intraprovincial migration by four-year time period, five Ottawa region census divisions, number of persons
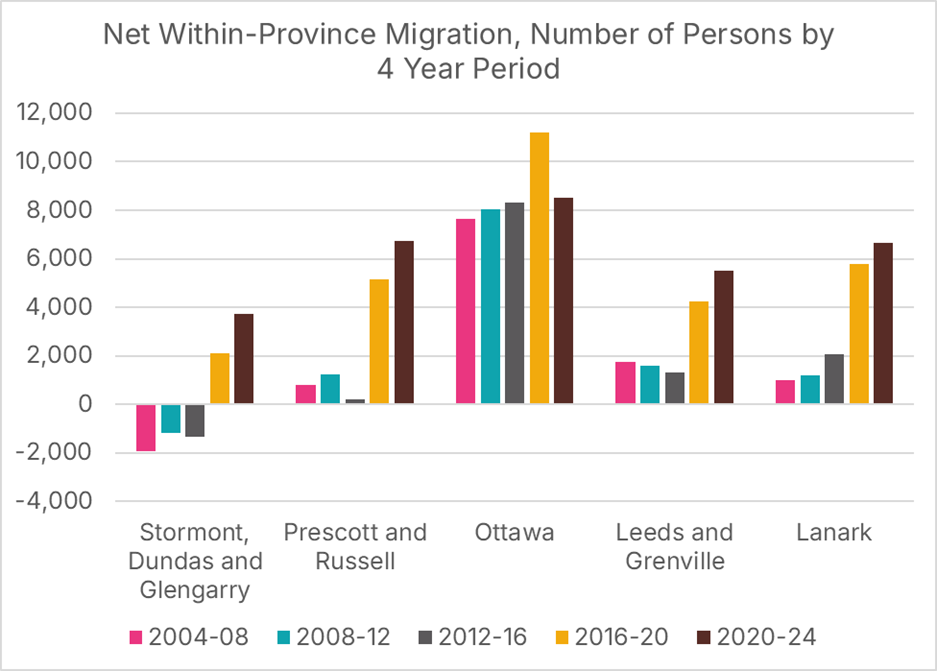
Data Source: Statistics Canada Table 17-10-0153-01, Chart Source: MMI.
Because the four Ottawa region Census divisions have experienced large increases in the number of persons moving there from other parts of the province, while the City of Ottawa has not, the City of Ottawa’s share of this growth has diminished over time. Two decades ago, the City of Ottawa received over 80% of the Ottawa region’s net intraprovincial in-migration. In the last four years, however, this share has dropped to just 27%, only somewhat above Prescott and Russell (22%) and Lanark (21%).
Figure 9: Total net intraprovincial migration by four-year time period, five Ottawa region census divisions, number of persons
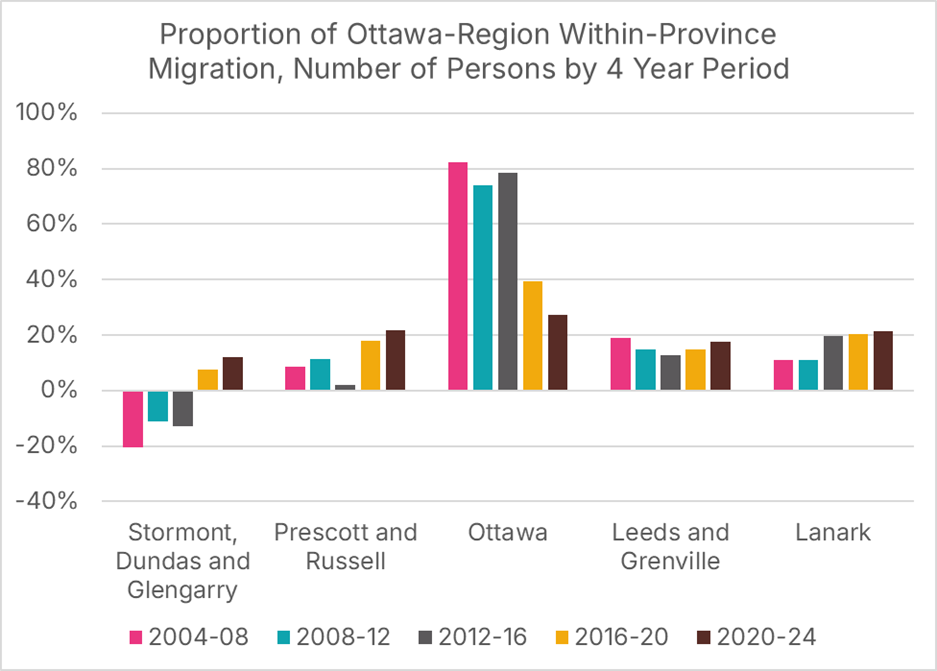
Data Source: Statistics Canada Table 17-10-0153-01, Chart Source: MMI.
Relative to the size of the existing population, the communities surrounding the City of Ottawa are experiencing a significantly higher rate of families relocating from other parts of Ontario. Between 2020 and 2024, the City of Ottawa added 2 persons from intraprovincial migration, on net, per 1000 residents each year. In contrast, Lanark Census division added 20, one of the highest rates in the province.
Figure 10: Average annual net intraprovincial migration per 1000 residents, July 1, 2020, to June 30, 2024, by Southern Ontario census division

Data Source: Statistics Canada Table 17-10-0153-01, Chart Source: MMI.
Given past outmigration patterns, Families on the Move forecasts, at a minimum, 10,000 more families per year than the Ontario Ministry of Finance projects will migrate out of the GTA to other parts of Ontario. The report examines the scenario in which their choice of locations to migrate to will be roughly proportional to their 2019-24 choices, though it notes that migration to Hamilton-Niagara and Kitchener-Waterloo-Barrie may be reduced in future years, given growing housing shortages in those regions. This adjustment subtracts 300,000 families from the GTA’s population projections for 2021 to 2051, and adds 300,000 to the rest of the province.
Given those past migration patterns, it is estimated that 10% of the GTA outmigration will settle in the Ottawa Region, adding 30,000 families over the next 30 years. Those 30,000 families are then allocated to each census division, based on their proportion of ground-oriented housing supply growth. For example, Lanark census division accounted for 2,505, or just over 9%, of the Ottawa Region’s 27,785 ground-oriented housing stock increase from 2016-21. As such, they will be allocated just over 9%, or 2,705 of the Ottawa Region’s 30,000 “drive until you qualify” homes.
Figure 11: Projected ground-oriented housing need, 2021-51, five Ottawa-area census divisions, excluding enhanced intraprovincial migration, including GTA adjustment
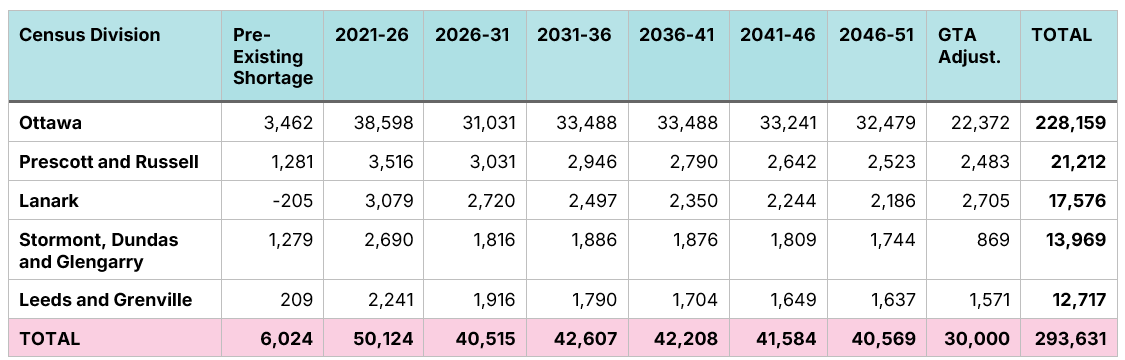
Chart Source: MMI.
Lanark will receive a higher proportion of Ottawa-region families than forecasts indicate
Using the same method as with apartment units, we can compare the City of Ottawa’s Growth Projections for the New Official Plan estimates for ground-oriented housing with ours. We find that their estimate falls 82,000 units short of the required amount.
Note: As with apartments, to ensure a fair comparison between the two systems, we take the City’s 2041-46 ground-oriented housing need projection and replicate it for 2046-51.
Figure 12: Projected apartment unit need, 2021-46, City of Ottawa, our estimate vs. City growth projections
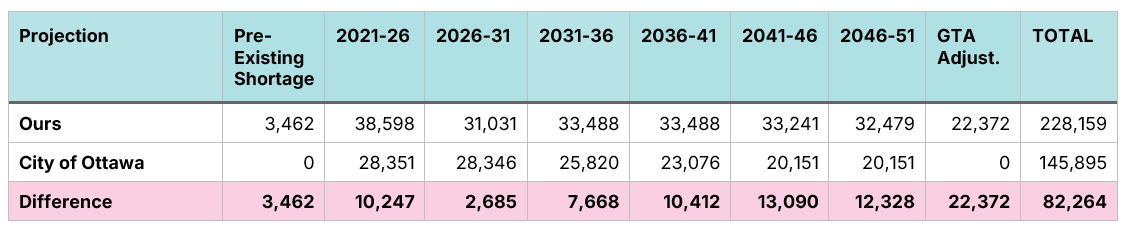
Chart Source: MMI.
Unlike with apartments, this gap will be much harder to fill. To determine how challenging it will be to build these many units, we examine how many would be built if the stock of ground-oriented houses grew at the same pace as it did between the 2016 and 2021 Censuses. For three of the five census divisions, there is little difference between the pace needed in the future and that of the previous five years. For the City of Ottawa, however, increasing the ground-oriented housing stock at past rates would leave the City 109,360 units behind what is needed. For Stormont, Dundas, and Glengarry, an additional 9,227 units would be required.
Figure 13: Projected ground-oriented housing need relative to past construction pace, 2021-51, five Ottawa-area census divisions, excluding enhanced intraprovincial migration
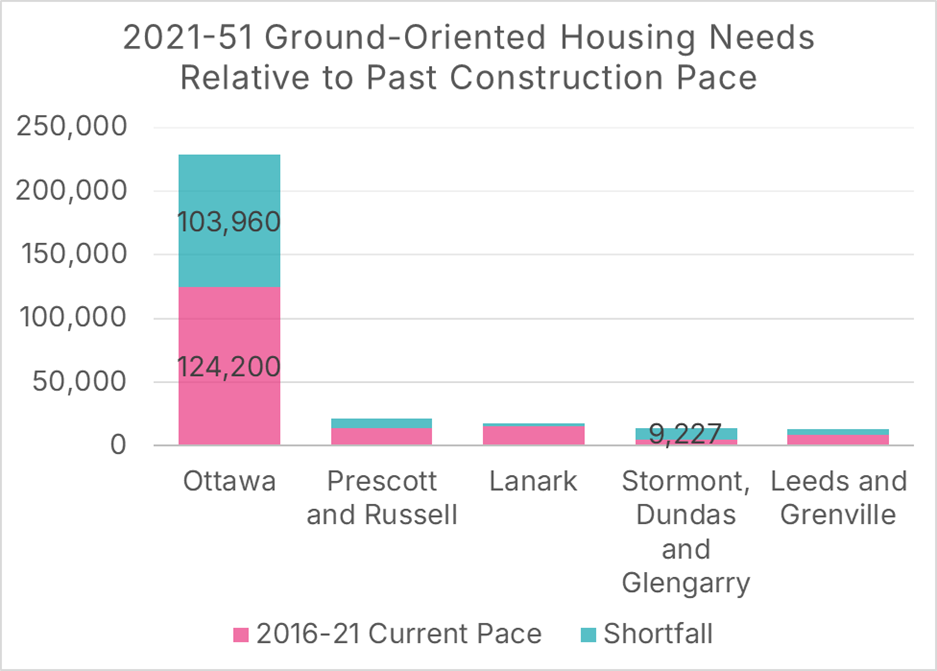
Chart Source: MMI.
To put the City of Ottawa’s ground-oriented housing needs into perspective, the City needs to grow its stock by over 7,600 units each year over the next 30 years. There has been no single year in which the City has achieved this goal. Over the last two years, the City has averaged only 3,000 ground-oriented starts per year, which is less than half the required number.
Figure 14: Ground-oriented housing starts by year, City of Ottawa
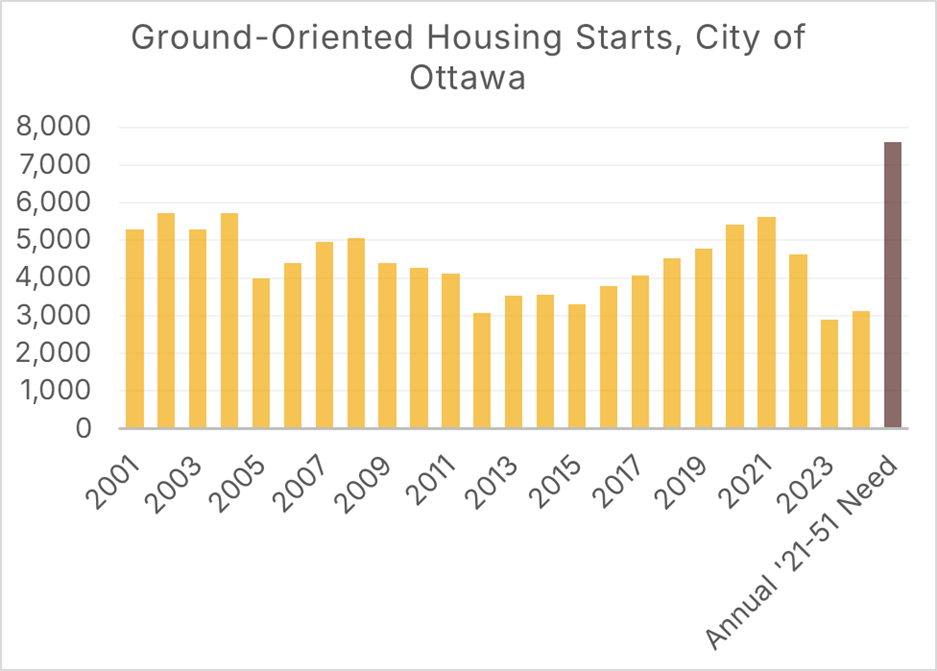
Data Source, CMHC. Chart Source: MMI.
Given the current regulatory and tax environment in the City of Ottawa, the City will find it challenging to meet its currently far too low ground-oriented housing projections, let alone increase them.
Reallocating the 82,000 ground-oriented housing shortfall to the other four Census divisions illustrates the need to build
We can re-allocate the 82,264 home shortfall from the City of Ottawa to the other four Ottawa Region census divisions, to illustrate the size of potential spillover effects. We will adopt the same method used for allocating GTA spillovers, allocating proportionately to the 2016-21 ground-oriented housing stock increases. This method allocates 35% of ground-oriented housing demand to Lanark, 33% to Prescott and Russell, 21% to Leeds and Grenville, and 11% to Stormont, Dundas, and Glengarry.
Figure 15 reveals that this adjustment increases ground-oriented housing needs from 2021 to 2051 to over 46,000 units in both Lanark and Prescott and Russell Census Divisions.
Figure 15: Projected ground-oriented housing need, 2021-51, five Ottawa-area census divisions, adjusting for the City of Ottawa growth plan
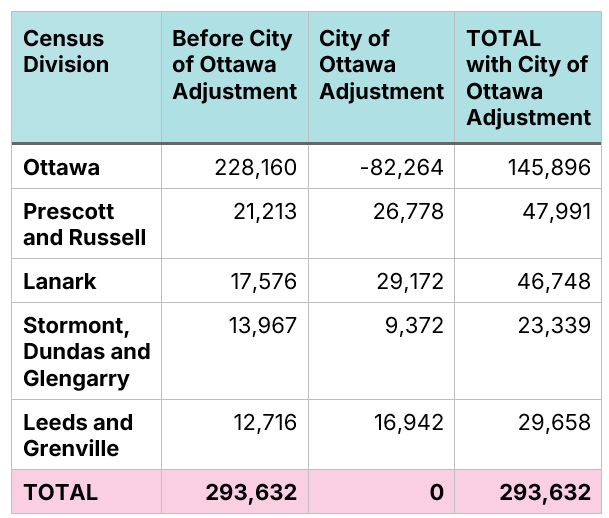
Chart Source: MMI.
Families are mobile and move to communities offering attainable housing and a high quality of life
While new homebuyers are unable to enter the market in larger cities due to an undersupply of new housing, which has driven prices beyond reach, rural municipalities like Lanark offer opportunities for families and retirees to fulfill their housing needs and dreams. Recognizing that government policy decisions have eroded the attainability of market-priced housing, rural municipalities can counter that trend by anticipating how their communities can embrace accelerated growth and offer attractive housing choices for residents and new neighbours.
However, this growth requires substantial infrastructure investment, which provides financing challenges for smaller municipalities. In recognition of the rural municipalities’ roles in achieving Ontario’s housing targets, the provincial government is enabling the use of communal water and wastewater infrastructure, with financing and service delivery models that can be adopted to create housing densities and typologies that have historically been unfeasible in smaller, more rural communities. The enabling infrastructure these reforms unlock can create new opportunities for Lanark to determine how it should grow and properly plan for that growth.
For a PDF of this article, click on the link below
.
All this requires that there will be jobs for the families which will support the tax base needed to supply the require infrastructure.
What are the corresponding Job market projections? What sort of energy, transportation, and information infrastructure is required to enable this?