

Housing Shortages Grow Fastest in Smaller Ontario Metros
Brantford, Peterborough, and Sudbury are struggling to keep up with population growth

Welcome to a bonus Monday installment of the Canadian Housing Microresearch Project (CHMP). Today, we examine how Canada’s population grew by over 500,000 households last year while adding fewer than 250,000 houses. One trend that stands out is that even relatively slow-growing Ontario metros like Guelph and Thunder Bay had poor homebuilding performance last year. Ontario’s housing crisis is not simply a Toronto one.
The previous piece in this series showed that Canada’s population grew by over 500,000 households but added fewer than 250,000 houses. Recently released population data from Statistics Canada allow us to perform the same analysis at the city (metro) level. Surprisingly, it is not the biggest cities that are most struggling to keep up with population growth.
Our unit of analysis today is census metropolitan areas (CMAs, known more simply as “metros”), which are cities that include their neighbouring communities. For example, the London CMA includes St. Thomas, the Montréal CMA includes Laval and Longueuil, and so on. When we talk about Toronto CMA, think of the GTA, not the City of Toronto.
Last year, the population of Canadian metros collectively grew by 1.075 million, with non-metros adding 130,000 persons. All 41 of Canada’s CMAs experienced population growth of over 1% last year, with seven experiencing growth of over 4%. Despite a belief among some Ontarians that we are experiencing disproportionate growth relative to the rest of the country, only two of the seven fastest-growing metros are in Ontario. Last year, Calgary and Moncton were the fastest-growing metros in Canada.

(Note: We separated Ottawa-Gatineau CMA into Ontario and Quebec components)
Not surprisingly, in absolute terms, the metros that added the most persons were places were large cities with NHL teams, though Kitchener-Cambridge-Waterloo added more than Winnipeg, in large part due to a dramatic increase in international student enrollment at Conestoga College.

This, of course, raises the question: “How many additional homes would the metros need to keep up with population growth?”
Because the population data includes population by age, we can convert this population growth into an estimated number of RoCA Households, as we did in our previous piece. Interestingly, unlike population, the number of RoCA Households grew more in Winnipeg than in Kitchener-Cambridge-Waterloo (KCW). This is because KCW’s population growth occurs with younger people, who tend to form larger households.
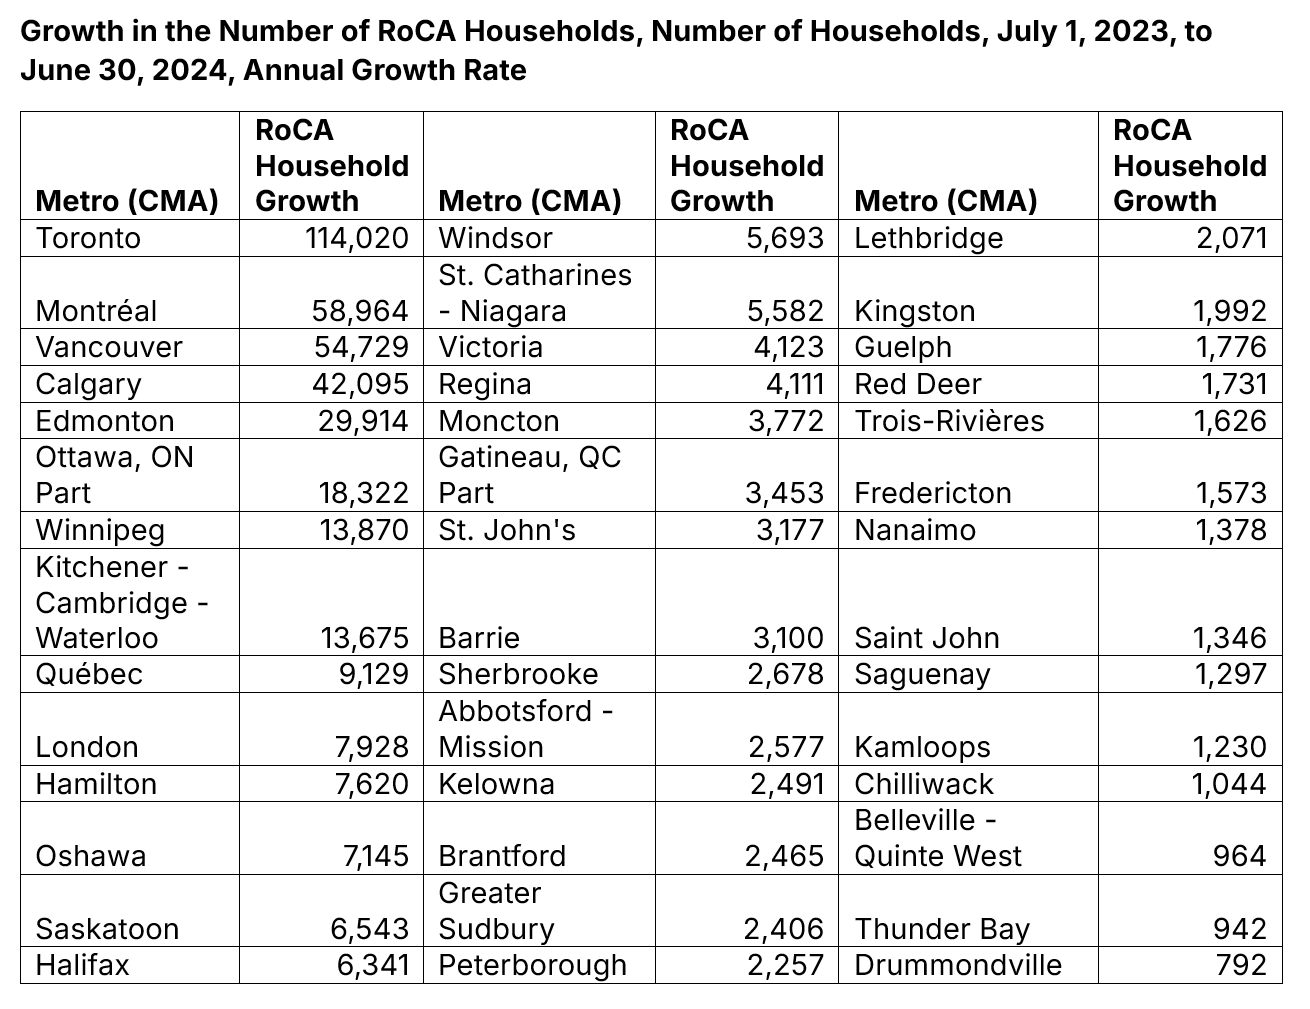
Using CMHC data, we can then compare these values to housing starts from July 1, 2023, to June 30, 2024, to see where housing growth kept up with population growth and where it didn’t.
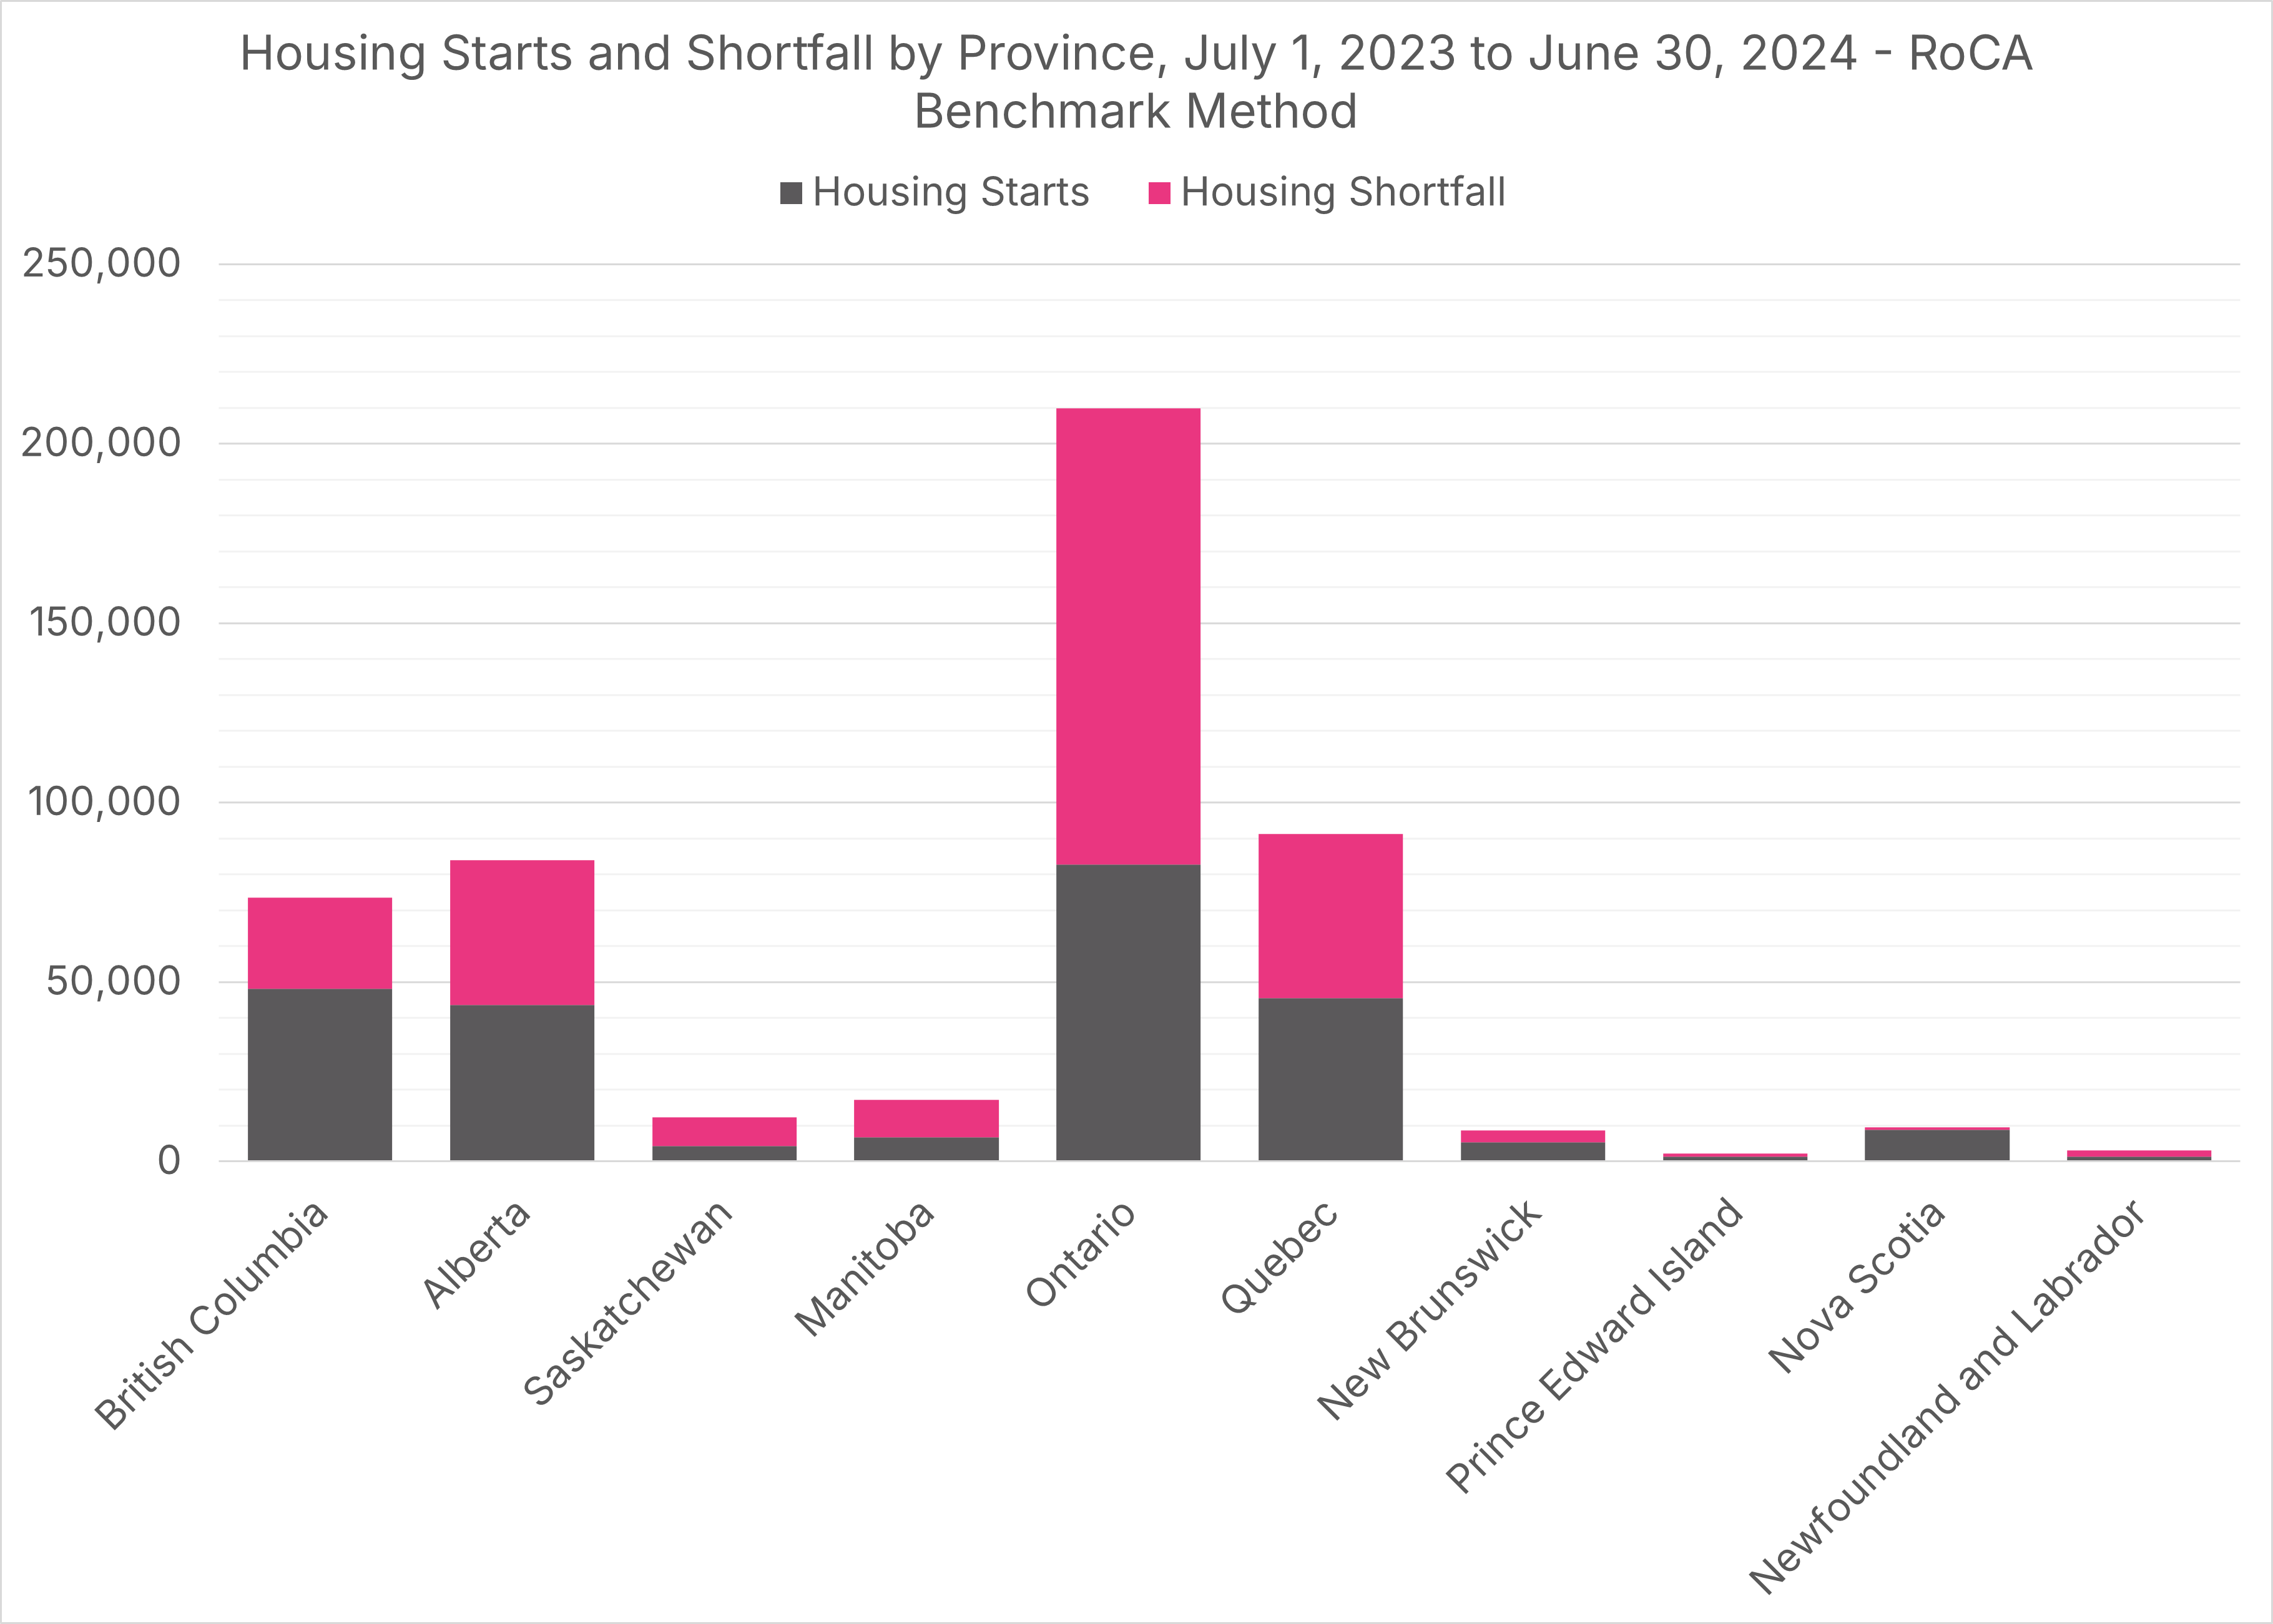
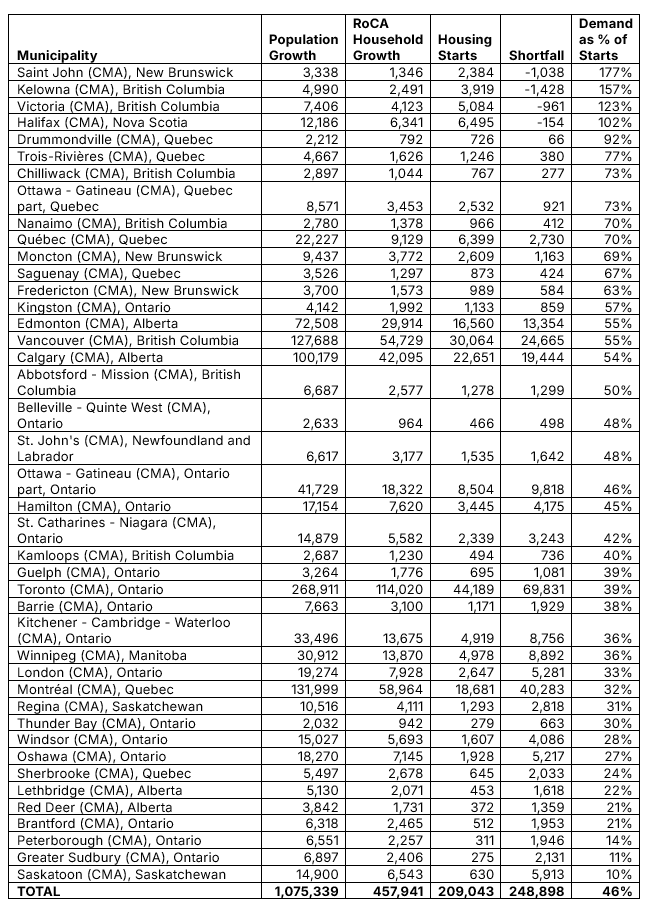
Overall, the population of Canadian metros increased by 1,075,339 people, adding to the demographic demand for 457,941 homes. However, only 209,043 housing starts were made in these communities, or 46% of what was actually needed. This is a stunning indictment of both housing policy and population growth policies and needs to be stated again.
Canadian cities are building less than half of the housing they need to keep up with population growth.
I would normally post the performance of each metro here, but since it’s a huge chart, we’ll save it for the end of the piece. Instead, here is the performance in each region of the country.

The obvious question to ask here is, “why were metros in some regions better able to have housing starts keep up with population growth than others?” One possible answer is that some metros grew faster than others in terms of new households, and those faster-growing metros were less able to keep up with that growth.
There is a relationship between the two, but it is weaker than you might think. No metro with annual population growth above 2.5% also had housing starts above 80% of its RoCA household growth, which does suggest some relationship between the two variables. Beyond that, however, there is almost no correlation between housing starts and RoCA household growth.
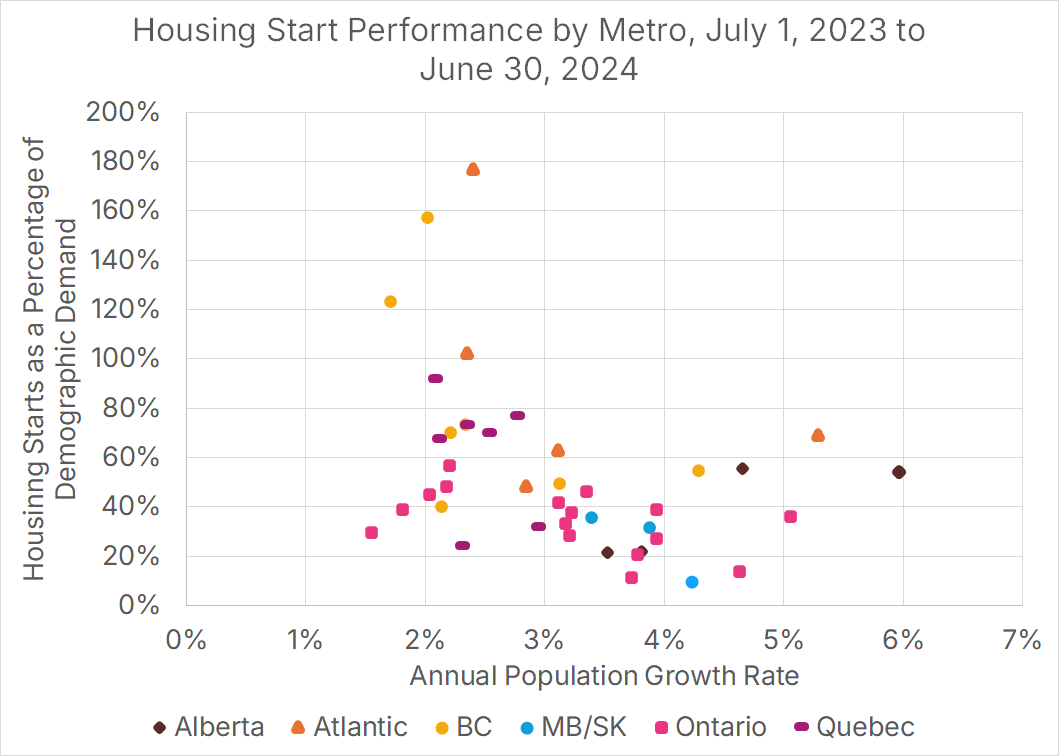
The chart clearly shows that for any given level of population growth, communities in Ontario (along with Manitoba and Saskatchewan) are near the bottom of homebuilding performance. This relationship becomes clearer when we split our metros across two axes:
Those with population growth rates above 3%, and those below.
Those that had housing start levels at least 50% of the level of their demographic demand, and those below.
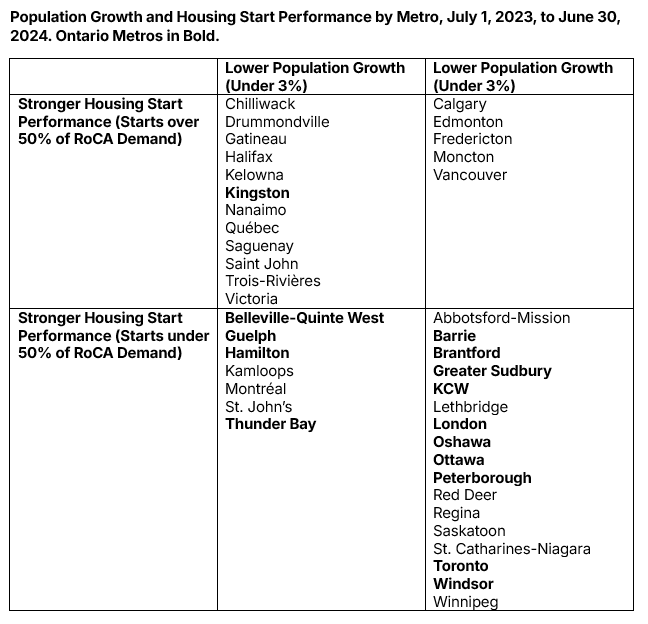
Ontario’s dominance of the bottom half of this chart shows the depth of the province’s housing crisis.
There’s this folk theory of the housing crisis among many Canadians that sounds something like this:
“Canada’s population surged because of immigration, and all of those new folks settled in Vancouver and Toronto, causing housing shortages in those markets. Outside of those places, there is no housing crisis.”
When, in reality:
Vancouver and Toronto don’t even crack the top-5 in terms of population growth, with Vancouver finishing 6th out of 41 metros and Toronto 9th.
Population growth was rapid, though uneven, across the country.
Many slower-growing communities still experienced rising rents and poor housing start growth.
Ontario communities struggled to build homes, regardless of how quickly they were (or were not) growing.
In short, as we saw in our previous piece, Canada has a homebuilding problem, and nowhere is that problem more acute than in Ontario.
For completeness, here are the performance levels for all 42 of our communities (41 CMAs, with Ottawa-Gatineau CMA split into two), ranked from highest to lowest performing.
In short, Ontario has a massive problem, and it’s far more complex than “Toronto’s population soared.”