

Planning Based on Yesterday Is How You Get Today’s Housing Crisis
How Ontario’s population projections are locking in the housing shortage

Highlights
Bad forecasts have become housing policy: The Ford government now requires municipalities to plan using Ministry of Finance population projections, even though those numbers rely on unrealistic assumptions about how communities grow.
Ontario’s population forecasts don’t just describe the future, they shape it: When flawed projections are baked into municipal planning, they directly influence where housing is allowed to be built.
Population projections from 2009 highlight the forecasting problem: The Ministry’s model assumes that places that have attracted many families in the past will continue to do so in the future. But those forecasts fail to account for the fact that those communities are in their “high growth” phase, akin to assuming children will continue to get taller at the same rate through age 100.
Communities, like adolescents, have growth phases. Places boom when land and infrastructure are available, then slow down or reverse once those constraints bind, a reality the forecasts systematically ignore.
Planning based on false certainty locks in scarcity. Due to the zero-sum nature of intraprovincial migration, overforecasting growth in some places means underforecasting it elsewhere, leaving fast-growing communities without the housing, land, and infrastructure they need, and perpetuating Ontario’s housing crisis.
Miké the Giant
If Ontario used the same logic to predict human height that it uses to predict population growth and migration patterns, I’d be over 12 feet tall today.
Poor population forecasts are not just a problem; they are a driver of the housing crisis. As we highlighted in Built to Fail, the Ford government now requires municipalities to use the Ontario Ministry of Finance’s population projections in their municipal planning. MMI supports municipalities working from a single set of numbers in their planning, but the Ministry of Finance numbers are based on flawed assumptions about how cities grow. Those forecasts assume that recent growth patterns will continue indefinitely, even when the underlying conditions that made that growth possible no longer exist. Those flawed forecasts aren’t just wrong; they’re being used to decide where housing can be built.
The consequence is a planning system that systematically underestimates where people will actually live, which perpetuates the housing shortage, as communities that will grow in the future underinvest in infrastructure and do not make enough land available for development.
This forecasting problem becomes apparent when examining the Ministry’s 2009 population projections, which assumed that large numbers of Ontarians would move to Peel Region and York Region, triggering a population boom. Instead, despite record immigration and non-permanent resident growth, these two regions grew more slowly than predicted, as over the last 16 years, more families have left these communities for other parts of Ontario than have moved in from other parts of the province.
Going back in time
Past Ontario Ministry of Finance population projections can be difficult to find, but the City of Mississauga has the Ministry’s 2009 release on its website, which provides projections for 2008 through 2036. Those 2009 projections have Ontario’s population growing to 15.6 million persons by Canada Day, 2024. Instead, the province’s population grew to 16.1 million, or 530,000 more than predicted.
Given the unexpected increase in the non-permanent resident population and immigration, under-forecasting Ontario’s 2024 population by 530,000 persons in 2009 is understandable. The 2009 Ministry of Finance population projections provide breakdowns of expected population growth into births, deaths, and net migration (both international and people moving to Ontario from other provinces). Interestingly, the province added far more than 530,000 additional persons from migration; instead, that growth was over 1 million more than forecasted. Those gains from migration were offset by 80,000 more deaths than projected and 270,000 fewer births. The drop in the number of babies aligns well with recent research showing that declining housing affordability leads to lower birth rates.
Figure 1: Number of Ontario births, deaths, and net number of persons moving into the province (both international and domestic), by year, relative to 2009 Ministry of Finance projections
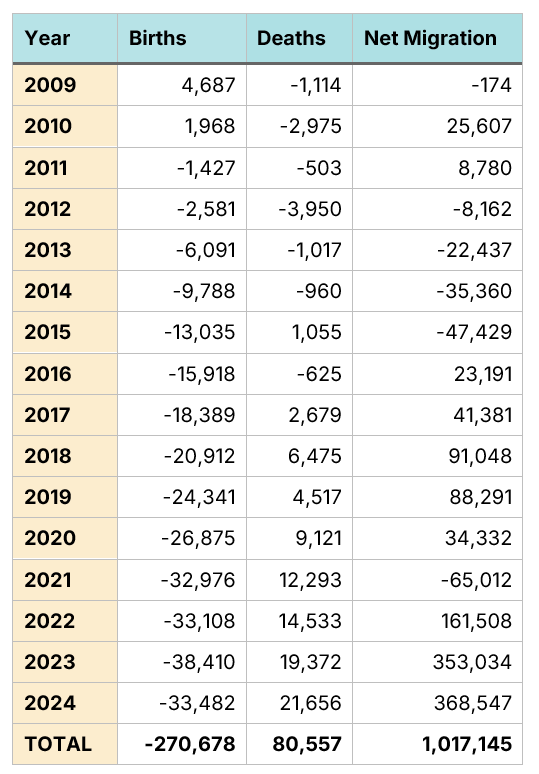
Data Sources: Ontario Population Projections 2008-2036 and Statistics Canada Table 17-10-0153-01. Chart Source: MMI.
Given that Ontario’s “unexpected” growth came from immigration (permanent residents) and non-permanent residents, it would seem safe to assume that the communities in Ontario that grew faster than expected would be places that attract international newcomers. Historically, over two-thirds of permanent-resident immigrants who moved to Ontario settled in the GTA. We would conjecture that communities like Brampton in Peel Region and Richmond Hill in York Region would have grown much faster than expected in the 2009 projections. We would also expect communities with a high proportion of international students, such as Waterloo and London-Middlesex, to have grown much faster than forecast.
That conjecture would only be partially true. While the City of Toronto, along with “college” towns like Windsor, London, and Hamilton, did grow faster than expected, most of the GTA added fewer people than projected in 2009. Despite Ontario’s unforecasted (in 2009) population boom, The Regions of Durham, York, Peel, and Halton all saw their populations grow substantially less than projected, with Peel and Halton’s populations being 9% smaller in 2024 than forecasted.
Figure 2: Actual vs. projected population, number of persons, 2024, Ontario’s 12 largest census divisions, sorted by difference as a percentage of 2024 projected population
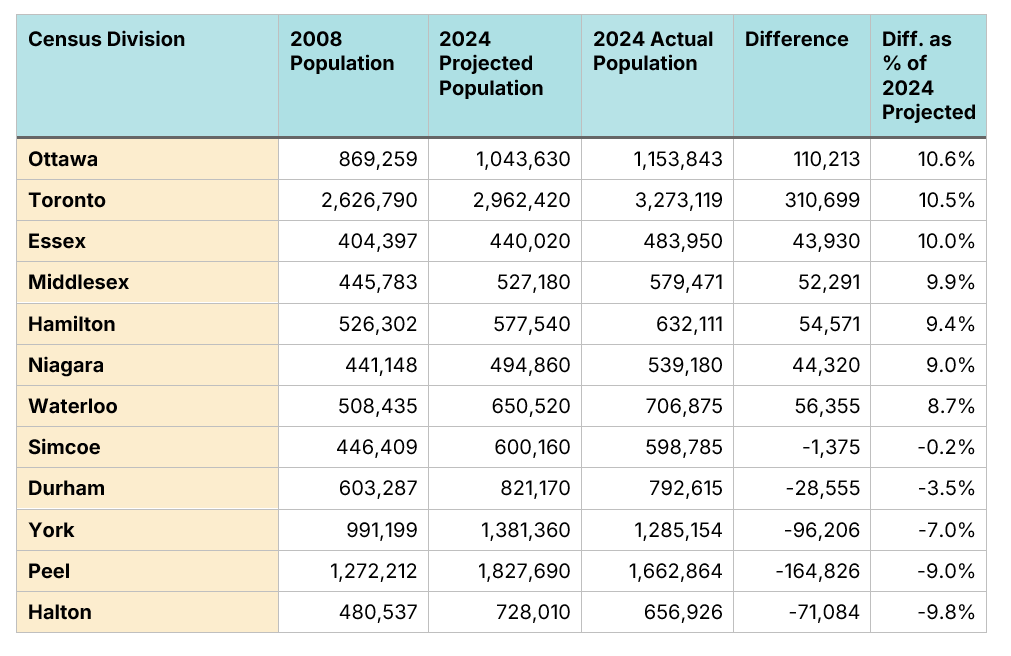
Data Sources: Ontario Population Projections 2008-2036 and Statistics Canada Table 17-10-0153-01. Chart Source: MMI.
As well, there were a number of communities that grew unexpectedly rapidly that we would not associate with growth driven by immigration, such as the Lanark Census Division just outside of Ottawa and Oxford County in Southwestern Ontario, home to communities such as Woodstock, Tillsonburg, and Ingersoll.
Figure 3: Actual vs. projected population, number of persons, 2024, 12 Ontario census divisions with unexpectedly high population growth rates
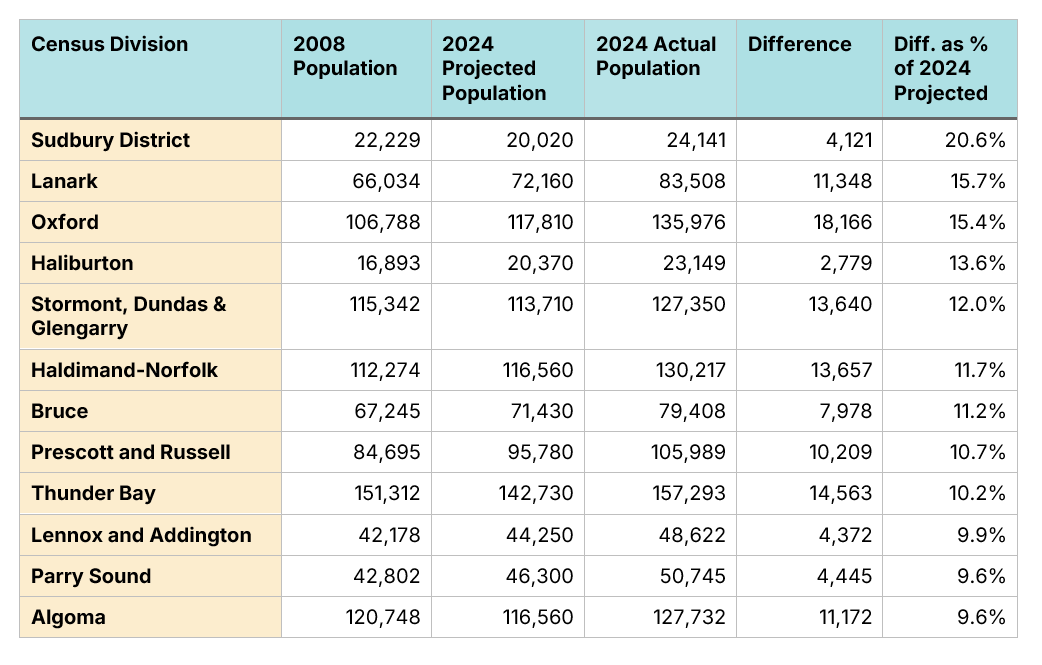
Data Sources: Ontario Population Projections 2008-2036 and Statistics Canada Table 17-10-0153-01. Chart Source: MMI.
One obvious explanation is that perhaps the newcomers did not settle where our conjecture would suggest they should have. Unfortunately, the population projections do not provide forecasts of expected annual migration at the Census Division level.
To a rough approximation, at the Census Division level, the Ministry of Finance looks at migration patterns over the last five years and projects them forward. The methodology document contains a number of statements, such as:
Emigration assumptions at the census division level: The projected number of people, by age and gender, emigrating from each census division for each year of the projections is modelled using the average emigration rates by age and gender for each census division observed over the past five years.
and
Non-permanent resident assumptions at the census division level: Projected shares of non-permanent residents for each census division are based on the share held by each census division in 2008. The age-sex distribution of non-permanent residents is based on the average of the last five years. The distribution pattern is assumed to remain constant over the projection period.
and
Interprovincial migration assumptions at the census division level: Each census division’s share of Ontario inflow and outflow of interprovincial migrants over the last five years is applied to projected flows for the province and held constant throughout the projection period.
We can conduct a crude version of this analysis by looking at migration patterns for the five years before 2008, to get annual averages for immigration, emigration, interprovincial migration, and net non-permanent resident growth, then project those forward for the next 16 years to get an expected level of migration for 2008-2024, as shown in Figure 4.
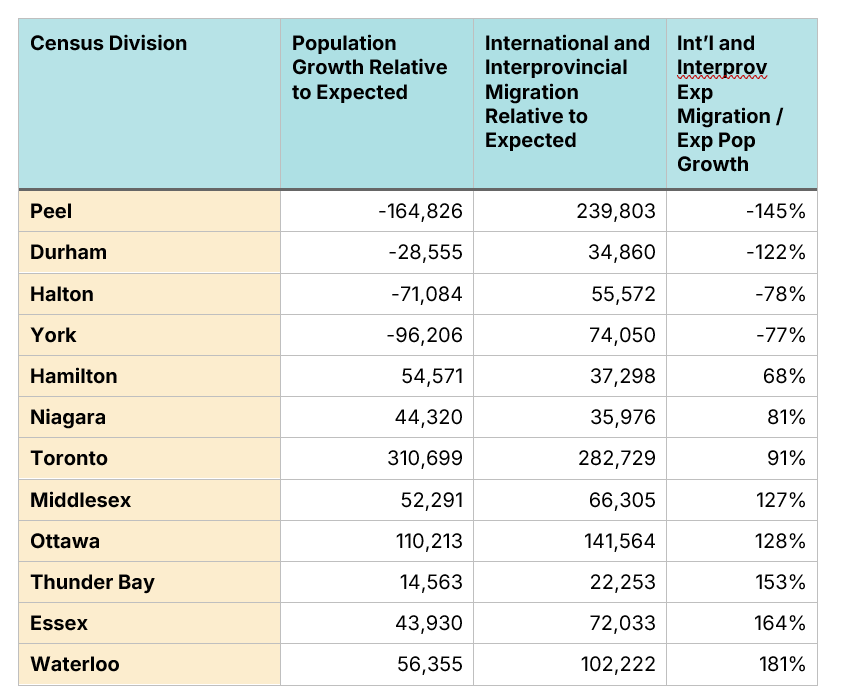
Figure 4: Actual vs. projected population growth via international and interprovincial migration, number of persons, 2008-2024, Ontario’s 12 census divisions with the largest growth through international and interprovincial migration
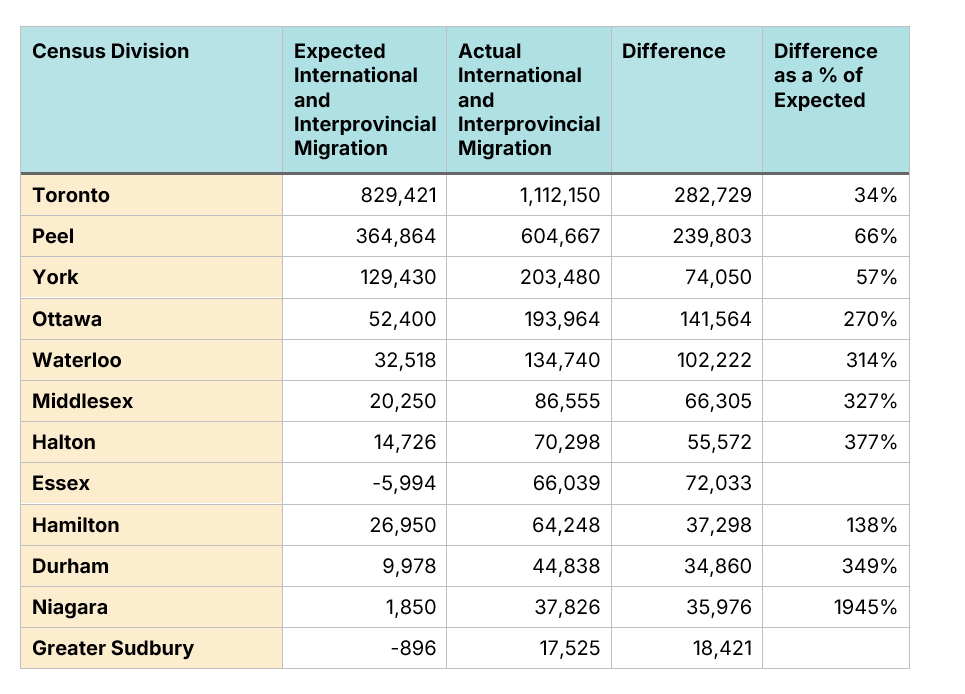
Data Sources: Ontario Population Projections 2008-2036 and Statistics Canada Table 17-10-0153-01. Chart Source: MMI.
Unsurprisingly, many of the places with unexpectedly high population growth, such as Toronto, Ottawa, and Waterloo Region, also had unexpectedly high migration growth. However, the Regions of Halton, Durham, and York also had unexpectedly high levels of international and interprovincial migration-based growth, and their populations grew more slowly than expected. Peel Region added 240,000 more movers than anticipated, and yet its overall population grew by 160,000 fewer than forecast, as shown in Figure 5.
Outside the city of Toronto, the GTA grew much more slowly than the 2009 forecast suggested it would, a pattern that cannot be explained by unexpectedly low levels of international and interprovincial (between provinces) migration.
Figure 5: Overall population growth and population growth through international and interprovincial migration, relative to 2009 forecasts, 2008-2024, Ontario’s 12 census divisions with the largest growth through international and interprovincial migration
Data Sources: Ontario Population Projections 2008-2036 and Statistics Canada Table 17-10-0153-01. Chart Source: MMI.
The experience of smaller Census Divisions that experienced unexpectedly high rates of population growth was also mixed. Some, like Frontenac (Kingston) and Wellington (Guelph), saw an unusually high rise in migration, likely due to the growth in international student numbers. However, a number of other smaller, more rural Census Divisions, such as Oxford, Lanark, Haldimand-Norfolk, and Prescott and Russell, experienced high population growth despite only a marginal increase in international and interprovincial migration.
Figure 6: Overall population growth and population growth through international and interprovincial migration, relative to 2009 forecasts, 2008-2024, twelve small Ontario Census Divisions with unexpectedly high population growth
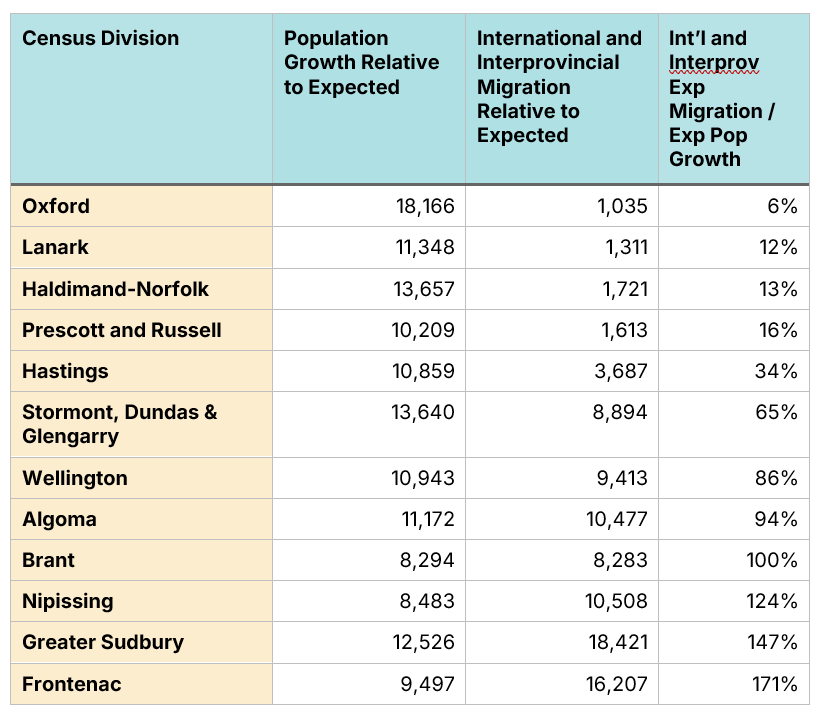
Data Sources: Ontario Population Projections 2008-2036 and Statistics Canada Table 17-10-0153-01. Chart Source: MMI.
The one form of migration we have yet to consider is intraprovincial migration, that is, people moving from one part of Ontario to another. We can conduct the same analysis, examining how many people, on net, the Ministry of Finance expected to move to (or from) an Ontario Census Division from 2008-24, using the “previous five years” methodology compared to the actual figures for this period.
Figure 7 examines the expected and actual intraprovincial migration numbers for 2008-24 for the 12 Census Divisions with the largest expected migration (in absolute terms). It shows that Toronto’s intraprovincial migration loss was 400,000 persons fewer than expected. The GTA communities of Durham and Halton gained fewer people than projected, while York and Peel saw a net outflow of population through intraprovincial migration, even though the Ministry forecasted they would continue to gain significant numbers of residents.
Figure 7: Net Intraprovincial migration, relative to 2009 forecasts, 2008-2024, twelve Ontario census divisions with the largest expected intraprovincial migration, in absolute terms
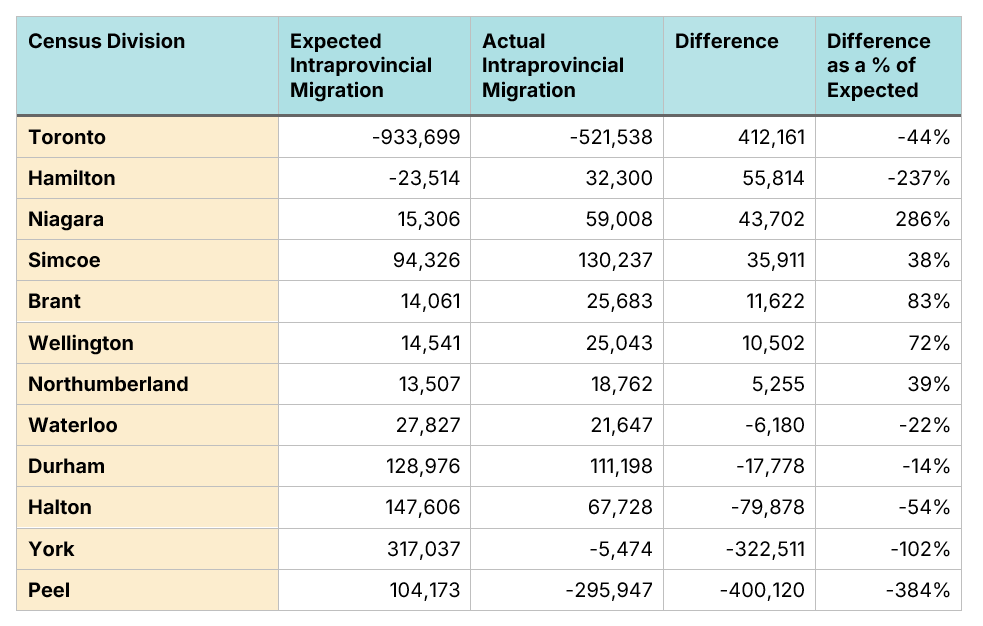
Data Sources: Ontario Population Projections 2008-2036 and Statistics Canada Table 17-10-0153-01. Chart Source: MMI.
Figure 8 shows the 12 Ontario Census Divisions with the highest actual net intraprovincial migration figures for 2008-24 that were not included in Figure 7. In every single case, actual intraprovincial migration substantially exceeded forecasts.
Figure 8: Net Intraprovincial migration, relative to 2009 forecasts, 2008-2024, twelve Ontario census divisions with the largest actual intraprovincial migration, excluding census divisions from Figure 7
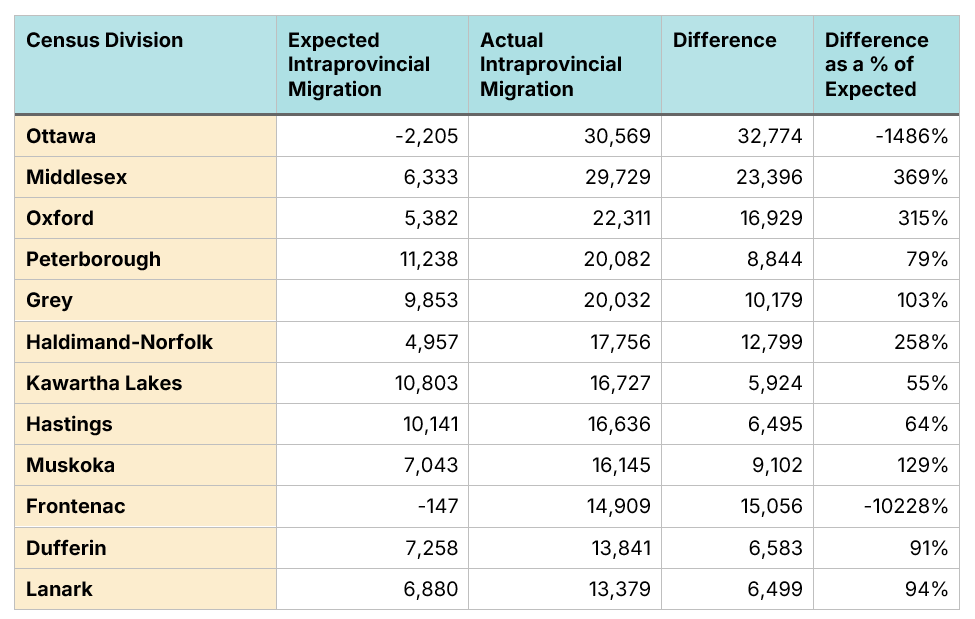
Data Sources: Ontario Population Projections 2008-2036 and Statistics Canada Table 17-10-0153-01. Chart Source: MMI.
For our four non-Toronto GTA census divisions (Durham, Halton, York, and Peel), it is clear that the unexpectedly low levels of population growth were caused by unexpectedly low intraprovincial migration, rather than due to international and intraprovincial migration being lower than forecast.
But does this result hold more generally? Are the relative differences between how much a community overshoots or undershoots its population forecasts due to poor forecasts of intraprovincial migration, or poor forecasts of international and interprovincial migration?
To answer this question, we calculated the correlations, at the census division level, across all 49 Ontario census divisions, between:
The size of the population growth forecast miss (population)
The size of the international and interprovincial growth forecast miss (inter growth)
The size of the intraprovincial growth forecast miss (intra growth)
Our results are as follows:
There is a near zero correlation between international/interprovincial misses and intraprovincial misses, with a coefficient of +0.01.
The correlation between population misses and international/interprovincial misses is +0.35, indicating that some locations grew faster than expected due to unexpectedly high immigration and non-permanent residents growth.
The correlation between population misses and intraprovincial misses is a whopping +0.90, making it clear that poor intraprovincial migration forecasts are the primary driver of poor population forecasts.
The reason why the 2008 population forecasts were so off on intraprovincial migration, and will continue to be off in the future, is that using the previous five years to predict future migration patterns does not work.
For example, between 1990 and 1995, I grew by over a foot. If my Doctor had employed the Ministry of Finance methodology in the mid-1990s to estimate my height in 2025, he would have predicted that I would grow an additional six feet in the last 30 years and would currently stand over 12 feet tall.
That height forecast would be patently absurd, as humans don’t grow linearly. But neither does intraprovincial migration. Communities gain new residents when the ingredients for development are available, including land and infrastructure. Growth booms. But eventually, that community either runs low on available development land or infrastructure, and growth stops. Eventually, these communities transition from a place families move to to a place people move from.
Both humans and communities experience rapid growth in adolescence. Predicting that growth will continue to happen, ad infinitum, is unreasonable. Bad predictions would be fine if they were just that: predictions. However, these predictions are used for planning purposes, and intraprovincial migration is zero-sum. If Ontario overforecasts the number of people who will move to Barrie or Whitby or Ottawa, it will underforecast the number who will move to Owen Sound, Beckwith, or Prince Edward County. And because those underforecasts get baked into planning assumptions, communities will not make enough land available for development or invest the infrastructure needed to support that growth. Planning becomes a tool for solidifying the housing crisis, rather than addressing it.
If Ontario is going to use population forecasts in planning, it needs to acknowledge that the future will not be like the past. It must also acknowledge that it is impossible to predict the future perfectly, so we must create conditions where communities can add far more housing than population forecasts predict.