

The State of Development Charges in Ontario
One Analyst's Recommendations for Fine-Tuning and Overhauling Ontario’s Development Charges System

BILD, the Greater Toronto Area’s Building Industry and Land Development Association, commissions research reports on housing from time to time. Three years ago, they commissioned our team to write Forecast for Failure, on the role inaccurate population forecasting played in southern Ontario’s housing crisis.
Today, BILD, in conjunction with the Ontario Home Builders’ Association, released the report The State of DCs in Ontario. Authored by Keleher Planning & Economic Consulting, it might be the most comprehensive report on the role of development charges in Ontario’s housing crisis.
The report, however, is very dense, and laypeople may struggle with some of the concepts. As such, we thought it might be useful to provide a quick seven-point summary of what stood out to us.
1. Development charges rose at a much faster rate than inflation
Anyone who has read our work will be aware of this, but it is still nice to have it confirmed. According to the Bank of Canada’s inflation calculator, prices rose in Canada by 31.7% between 2011 and 2023. Over this same period, in the GTA’s 10 largest municipalities, development charges for single-detached homes rose by an average of 208% (from $35,827 to $110,210), with the City of Toronto’s rising by 592%. In the 10 largest non-GTA Ontario municipalities, these DCs rose by 157% ($19,238 to $49,412). And, in some communities, development charges have increased substantially since 2023.
2. Development charges alone represent 25% of the cost of an affordable home
This may be our favourite chart in the report. It shows that if a developer wanted to keep the price of a home at a level that was affordable for families, the development charges alone would be over 25% of the price of the house in the Greater Toronto Area. The remaining 75% would have to pay for other taxes, land, construction of the house and, yes, builder’s profit.

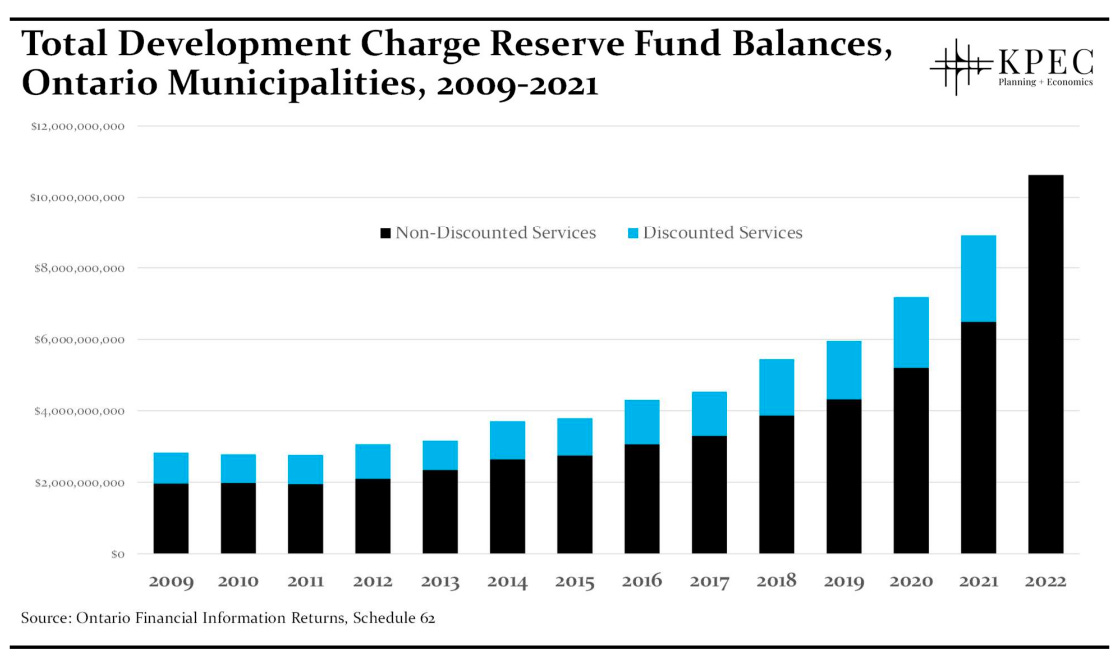
3. Unspent reserve funds are piling up
Development charge revenues go into a fund used to pay for infrastructure. Thanks to higher development charge rates, development charge revenues are growing faster than expenses, giving Ontario municipalities collectively over $10 billion in unspent infrastructure money.
4. Municipalities have other tools to finance infrastructure
A common argument from municipalities is that development charges are necessary to fund infrastructure, as there are limits to how much debt cities can issue. While there are debt limits, the report shows that municipalities are nowhere near the 25% of net annual revenues limit set by the province. In fact, debt levels have been falling in many municipalities.

5. What is and isn’t “growth-related infrastructure” is poorly defined
The core concept behind development charges is that “growth should pay for growth.” That is, the municipal costs related to building new homes should be paid for by the people who occupy them, not the general public. However, this requires identifying how much of any new piece of infrastructure is for new residents and how much is for the enjoyment of existing homeowners and renters, known as “benefit to existing.” However, the report shows that the current definition of “benefit to existing” is highly subjective and is inconsistently applied between one municipality and the next. The report provides a series of recommendations on how to create a more objective and fairer definition.
6. The way that municipalities account for the value of land they already own inflates development charges
This is incredibly wonky and defies a “explain it like I’m five” explanation. The short version is that municipalities have a cap on how much they’re allowed to raise development charges. However, that cap is a function of the value of the assets that the city already owns - the roads, the fire stations, parks and so on. Those values include not just the structures but the land under those structures.1 As the report puts it, including land values in DC calculations creates a “vicious cycle where higher land values from shortages of housing supply are putting upward pressure on DC rates, which are themselves hindering supply from being feasible, and so on.”
7. Moving water and wastewater to a rate-funded amortization model can save homebuyers hundreds of dollars a month while still ensuring that “growth pays for growth.”
This is also a bit wonky, but the idea is that instead of development charges and inclusion in the home price, water and wastewater infrastructure would be paid for by hook-up surcharges on water bills. Ultimately, new homebuyers are still paying the full cost for this infrastructure, but billions can be saved in interest costs because municipalities can borrow at lower interest rates than homebuyers. In a case presented in the report, a homebuyer’s monthly mortgage payment would be reduced by $343.60 a month. They would have to pay a monthly $196.11 water hook-up surcharge for 25-years (the same length of the mortgage loan), but still be ahead by $147.48 each month.
In short, there is a whole lot in this report, and a summary cannot fully do it justice. If you are interested in Ontario development charges, it should be on your reading list.
This whole section of the report reminded me of the movie The Founder, in which it is revealed that McDonald’s is actually in the real estate business, not the burger business.