

75% of Ontario's Demographic-Based Housing Demand is from International Migration
Ontario needs a lot more homes to support a growing population

Highlights
Since 2016, Ontario has experienced a population boom due to increased immigration and an international student boom.
Housing construction has not kept pace with this growth. Using the RoCA Benchmark method, we find in the last three years, Ontario would have needed to build 550,000 units to keep pace with growth. Housing starts over that period were less than 260,000.
The shortage is particularly acute for family-sized, ground-oriented homes (single-detached, semi-detached, and row homes). Only one-third of the needed housing starts were for these types of homes.
The shortage of family-sized homes has led to increasing unaffordability, increased homelessness, and massive overcrowding.
Politicians are to blame for Ontario’s housing crisis, and newcomers are its victims, not its cause. Politicians, along with the higher education sector, are responsible for ensuring that population growth policies and housing policies are aligned.
Given the human right to housing and the fact that newcomers are among the biggest victims of housing shortages, increasing population growth without matching increases in housing supply is not pro-immigration; it is pro-exploitation. Population growth advocates should and must do better.
Last week, we showed that Canada needs to build three million homes over a decade to solve the housing crisis. We received several thoughtful questions about where this demand is coming from and how we incorporate factors like the aging of the baby boomers. The most straightforward way to answer these questions is to use an example. Let’s take Ontario.
Our estimate of three million homes was derived using our RoCA Benchmark model. In that model, some factors add to demographic-based housing demand, while other factors subtract from it. Most of these are relatively straightforward: deaths cause a net reduction in housing demand, whereas new residents cause a net increase. Those factors are shown below.
Figure 1. Sources of Demographic-Based Housing Demand at a Provincial Level
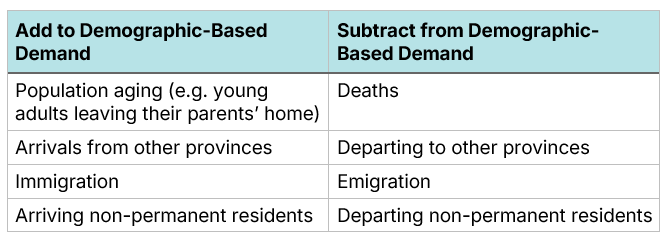
Let’s examine these one at a time.
Population Aging
One of the most noteworthy features of the RoCA Benchmark model is that births do not factor into housing demand. The model examines the age composition of the population and determines how many “heads of households” we would expect if there were no housing shortage. Because newborns and toddlers are never heads of households, they do not enter the RoCA formula.
At least those children do not create housing demand right away. As those babies age and reach adulthood, they begin to form households of their own. For example, Ontario had a housing boom in the late 1980s due to a high number of Baby Boomers forming households, along with a strong provincial economy.
Under the RoCA Benchmark method, for every 1000 20-24-year-olds a place has, it needs 209 homes. This more than doubles to 425 per 1000 for 25-29 year olds, increasing to a peak of 623 homes per 1000 70-74 year olds. This ratio sharply drops off after age 85, as a growing proportion of these “super seniors” enter retirement homes or care facilities. As populations age and transition into new age categories, more (or, in some cases, less) housing is needed.
Figure 2. RoCA Benchmark 2.0 Parameters - Homes Required per 1000 Individuals by Age
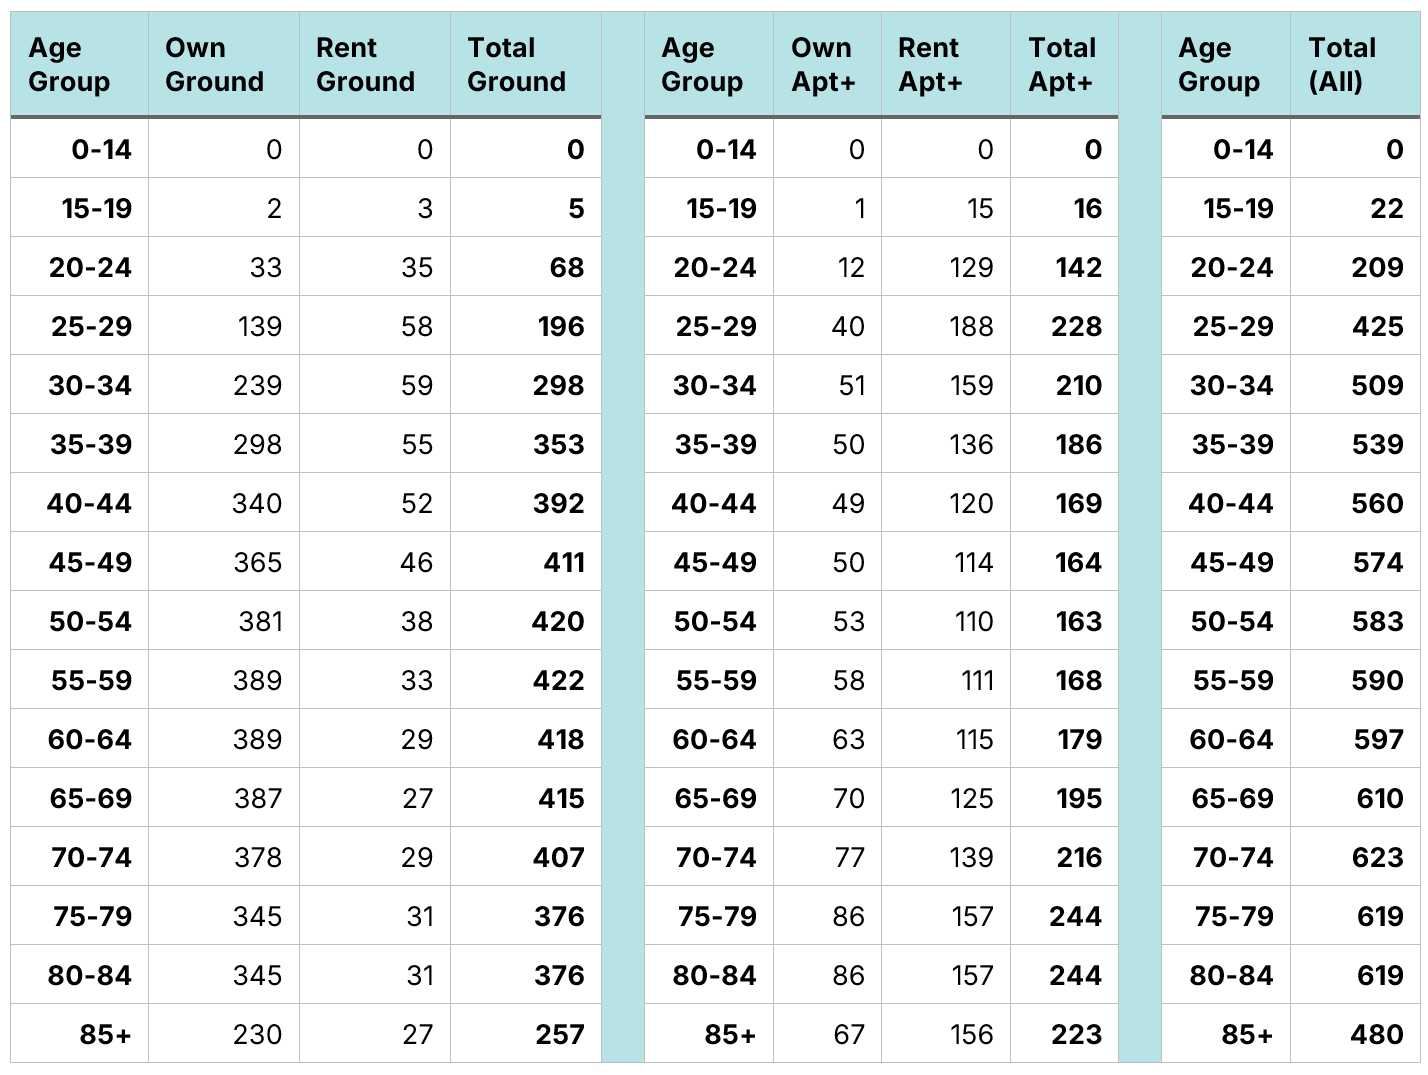
Source: Housing Needs Change as People Age: RoCA 2.0
Housing demand from population aging has been growing in Ontario in recent years due to the high number of people in their 20s living in the province. Last year, net new demographic-based demand from population aging reached 137,000 housing units in Ontario. Note that this does not incorporate reductions in demand due to mortalities.
Figure 3. Ontario: Total Net Demographic-Based Housing Demand from Population Aging by Year, Number of Units
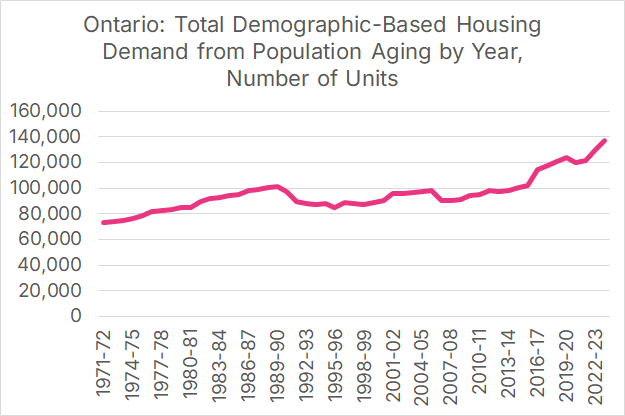
Source: Author’s Calculation from Estimates of the components of demographic growth.
Deaths
Deaths reduce net demographic-based housing demand by “freeing up” the housing supply from those who pass on. (Nobody said demographics was a pleasant subject.) The relationship between mortalities and housing is not one-to-one and depends on the deceased's age. Like population aging, it is based on the parameters from Figure 2. For example, for every 1000 80-84-year-olds who pass away, 619 homes become available.
The aging of the Baby Boomers has caused an acceleration in net reductions in demand from mortalities. Last year, mortalities were responsible for a 72,000 housing unit reduction in demand in Ontario. This is a rough doubling, in absolute terms, from forty years ago.
Figure 4. Ontario: Total Net Demographic-Based Housing Demand from Mortalities by Year, Number of Units
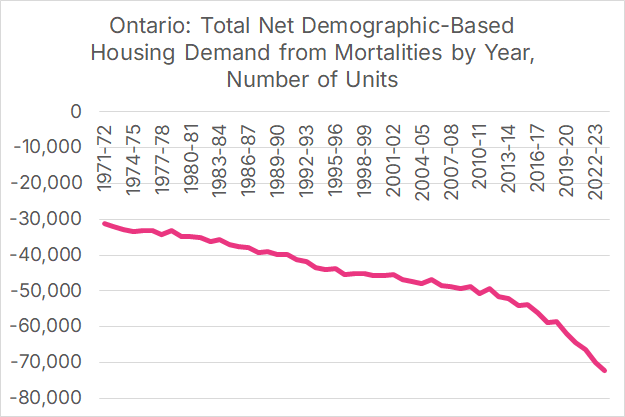
Source: Author’s Calculation from Estimates of the components of demographic growth.
There is a belief that the aging of the Baby Boomers will free up so many houses that we do not need to build as many as in the past. While accelerated mortalities have unlocked inventory (again, nobody said demographics was a pleasant subject), this is more than offset by the large number of Ontarians who have reached adulthood. We can illustrate this impact by combining population aging and mortalities into a single category.
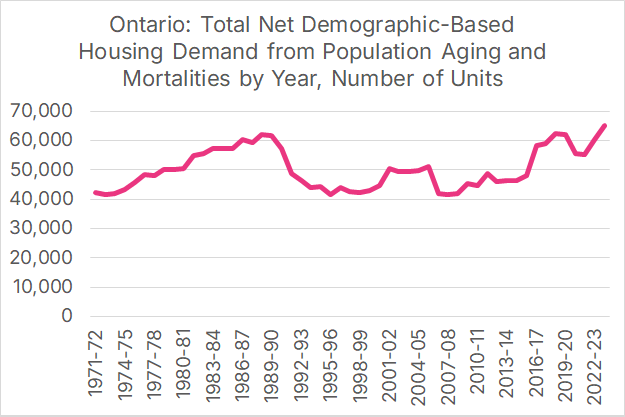
Last year, the net impact of population aging and mortalities created a need for 65,000 net new homes, a level not seen since Ontario’s late 1980s housing boom. This rise is partly due to the kids of the late 1980s baby boom reaching their peak homebuying years and partly due to newcomers to Canada from five or ten years ago also reaching their peak homebuying years.
Figure 5. Ontario: Total Net Demographic-Based Housing Demand from Population Aging and Mortalities by Year, Number of Units
Source: Author’s Calculation from Estimates of the components of demographic growth.
Interprovincial Migration
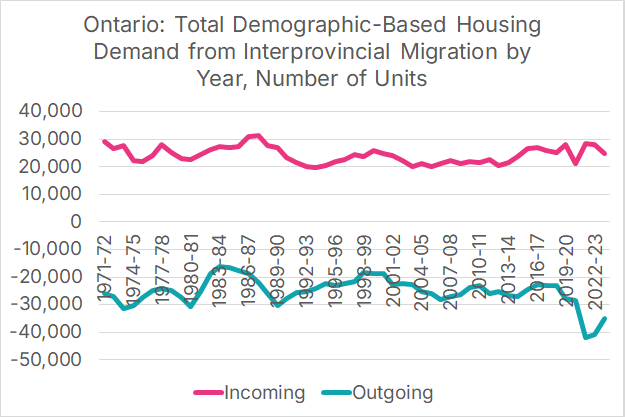
Interprovincial migration refers to people moving to Ontario from other Canadian provinces or people moving out of Ontario to elsewhere in Canada. Since the start of the pandemic, a growing number of young families have moved out of Ontario to other provinces, most notably Alberta, which has put some downward pressure on housing demand in the province.
Figure 6. Ontario: Total Demographic-Based Housing Demand from Interprovincial Migration, Incoming Residents to Ontario and Outgoing Residents from Ontario, by Year and Number of Units
Source: Author’s Calculation from Estimates of the components of demographic growth.
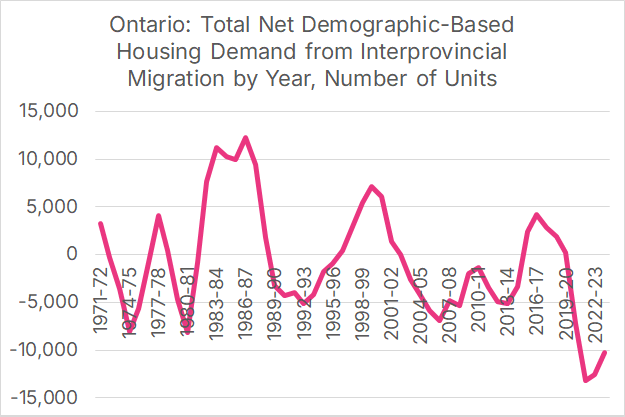
On average, Ontario’s net housing demand from interprovincial migration tends to be zero, as inflows and outflows are roughly in balance. But there are fluctuations. Ontario’s net interprovincial migration tends to be negatively correlated with oil prices, as when oil prices are low (mid-1980s, late-1990s, 2015-19), Ontario tends to attract households from Alberta, and when oil prices are high (2004-14), migration flows in the opposite direction. The post-2020 trend, however, has more to do with home prices than oil prices, as an increase in working from home has made it easier for young workers and families to change provinces in search of suitable housing they can afford.
Figure 7. Ontario: Total Net Demographic-Based Housing Demand from Interprovincial Migration, by Year and Number of Units
Source: Author’s Calculation from Estimates of the components of demographic growth.
Immigration
Definitions are important here. When we refer to “immigration,” we specifically mean those who obtain permanent residency in Canada. It does not include non-permanent residents, who appear in an entirely separate category.
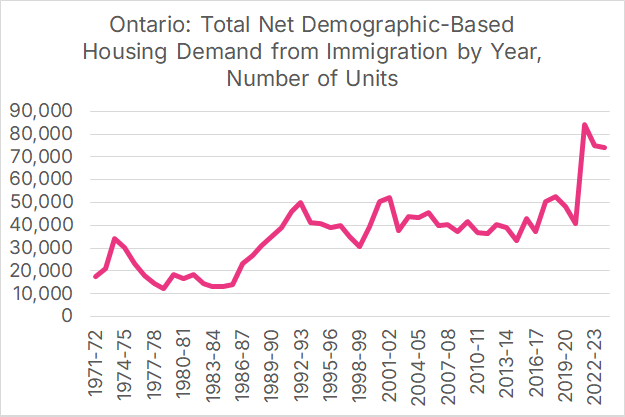
Over the last decade, the federal government increased Canada’s immigration target from 250,000 persons per year to 500,000, though recent changes will lower this target to 365,000 by 2027. Ontario’s share of new immigrants to Canada also increased after 2015 due to the oil price crash; the combination of a higher immigration target and an increase in Ontario’s immigration share resulted in a substantial increase in the number of immigrants settling in Ontario. This caused an increase in demographic-based housing demand. Between 2002 and 2016, Ontario’s demographic-based housing demand from immigration averaged 40,000 homes per year. Over the last three years, annual demand has been nearly double that, at just over 77,000 homes per year.
Figure 8. Ontario: Total Net Demographic-Based Housing Demand from Immigration, by Year and Number of Units
Source: Author’s Calculation from Estimates of the components of demographic growth.
Emigration
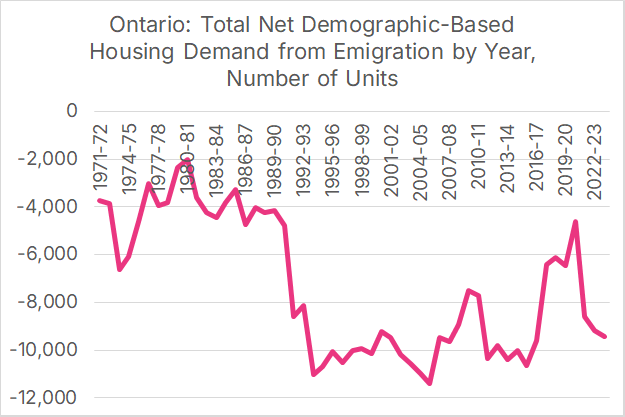
Emigration refers to Ontario residents who move to another country (regardless of their citizenship), with the United States as the most common destination. Despite beliefs to the contrary, Statistics Canada data finds that total emigration, including that to the United States, is currently in line with post-1990 averages. Using the RoCA Benchmark method, we find that emigration tends to “free up” roughly 10,000 homes a year in Ontario.
Figure 9. Ontario: Total Net Demographic-Based Housing Demand from Emigration, by Year and Number of Units
Source: Author’s Calculation from Estimates of the components of demographic growth.
Non-Permanent Residents
Non-permanent residents are anyone in Ontario on a time-expiring visa, including international students, international students who have graduated and are here on a post-graduation work permit, as well as a variety of temporary workers. Unfortunately, the Statistics Canada series we are using only provides a "net change” number, so unlike interprovincial migration, we do not have a separate series for arriving and departing non-permanent residents.
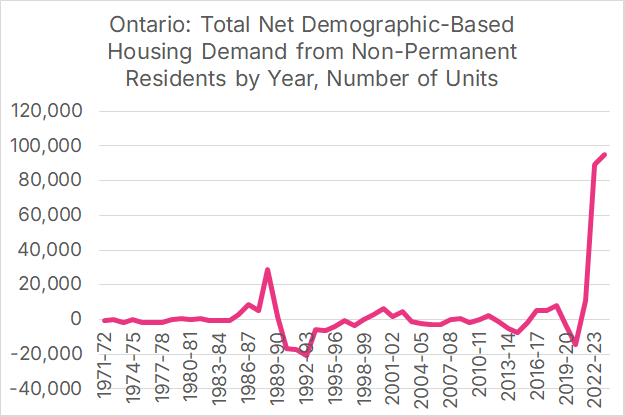
In most years in Ontario history, the number of arriving non-permanent residents and the number of departing ones is in rough balance, so the net impact on housing demand is minimal. There are exceptions, however; the late 1980s saw an influx of non-permanent residents, which created a need for more housing. Many of those same residents ended up departing in the early 1990s, causing a substantial reduction in housing demand.
Between 1998 and 2016, net new non-permanent residents accounted for no net housing demand per year. The province’s international student boom, which took off in 2015, saw this rise to nearly 8,000 units a year by 2017-18. The pandemic created a hiatus, but these numbers took off as the economy re-opened. In the last year three years, annual housing demand from net new non-permanent residents averaged over 65,000 units a year. To put this in perspective, total housing starts in Ontario have averaged 86,000 units per year over the last three years.
Figure 10. Ontario: Total Net Demographic-Based Housing Demand from Non-Permanent Residents, by Year and Number of Units
Source: Author’s Calculation from Estimates of the components of demographic growth.
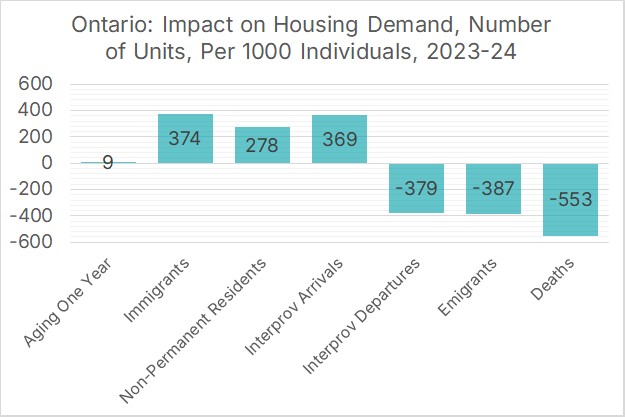
Because non-permanent residents are disproportionately international students, they tend to be quite young and live in larger households. The RoCA Benchmark methodology takes this into account and finds that for every 1,000 new non-permanent residents, 278 housing units need to be built to house them. In contrast, 1000 new immigrants to Ontario tend to need 374 homes, whereas newcomers from other provinces need 369, based on the age distributions of those newcomers.
Figure 11. Ontario: Impact on Housing Demand, Number of Units, Per 1000 Individuals, 2023-24
Source: Author’s Calculation from Estimates of the components of demographic growth.
Lots of New Housing Demand, Little New Housing Supply
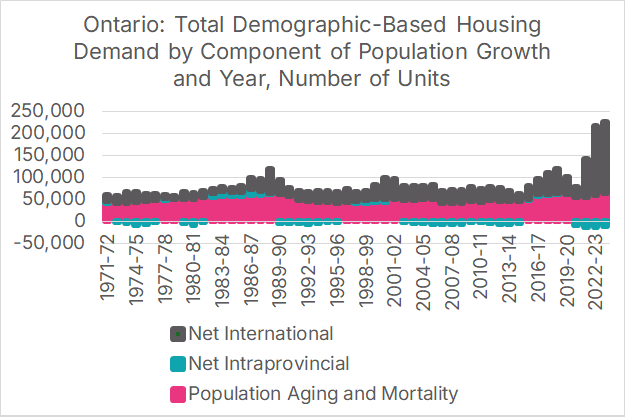
Ontario’s population started booming after 2015, causing a substantial increase in net demographic-based housing demand. In the four years spanning 2016-17 and 2019-20, Ontario would have needed to build 106,000 homes per year to keep up. Instead, annual completions averaged less than 68,000 units; this gap was the primary cause of growing unaffordability and the increasing exodus of middle-class families out of Toronto during this time. Since the end of the pandemic, this has only escalated further. We estimate that demographic-based demand was 128,496 units in 2021-22, 202,898 in 2022-23, and 214,694 in 2023-24. Demographic-based demand, in terms of total number of units, in the last three years has been equivalent to eight years of demand from 2007-08 to 2014-15.
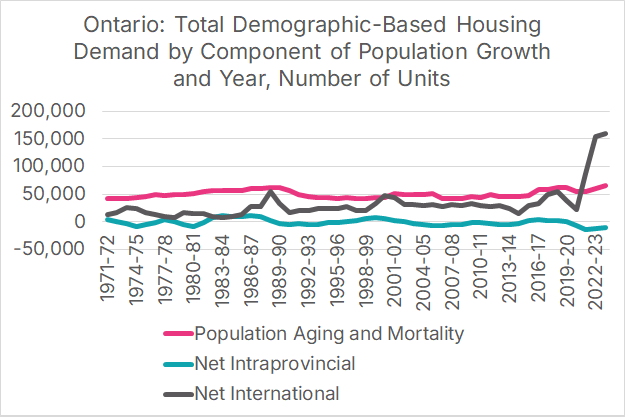
Figure 12. Ontario, Total Demographic-Based Housing Demand by Component of Population Growth and Year, Number of Units
Source: Author’s Calculation from Estimates of the components of demographic growth.
This net new demand came almost entirely from international migration. While there was some increase in demand due to population aging, this was offset by an increase in the number of Ontarians moving to other provinces, most notably Alberta.
Figure 13. Ontario, Total Demographic-Based Housing Demand by Component of Population Growth and Year, Number of Units
Source: Author’s Calculation from Estimates of the components of demographic growth.
Graphing demographic-based demand relative to housing starts makes the primary cause of Ontario’s housing crisis clear. The two tracked each other closely from the early 2000s to 2015. In 2016, demand boomed thanks to changes in immigration policy and the international student boom, but new supply did not.
Figure 14. Ontario, Housing Starts and Demographic-Based Demand by Year, Number of Units
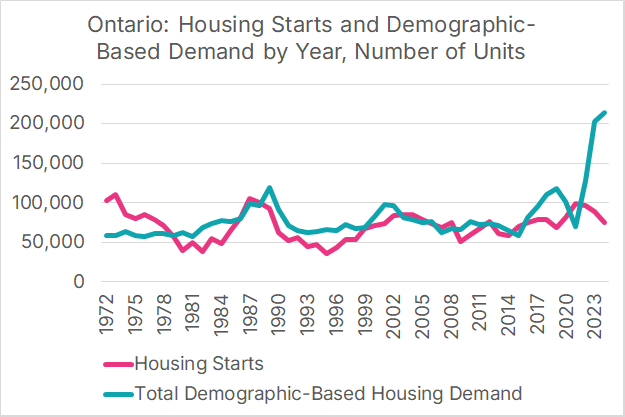
Source: Author’s Calculation from Estimates of the components of demographic growth and Canada Mortgage and Housing Corporation, housing starts.
The post-pandemic spike in housing demand is almost entirely due to international migration. Over the last three years, net immigration and the increase in the number of non-permanent residents have each contributed approximately 200,000 units of net demographic housing demand.
Figure 15. Ontario, Sources of Demographic-Based Housing Demand, Last 3 Years
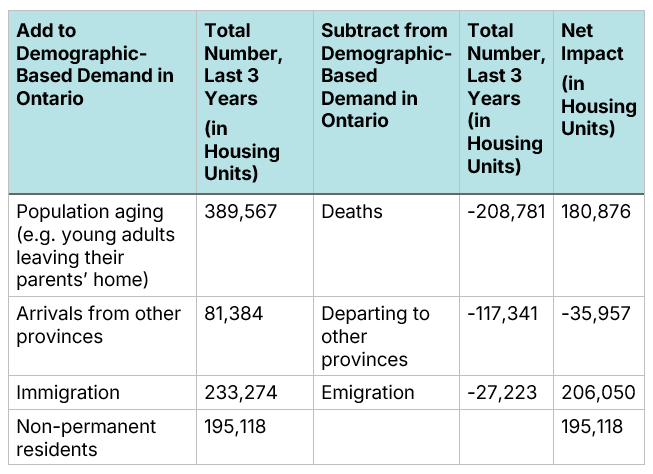
Source: Author’s Calculation from Estimates of the components of demographic growth.
The demand-supply mismatch over these years was enormous. While demographic-based housing demand was 550,000 units, the province had only 260,000 housing starts, less than half of what was needed. Ontario would have needed an additional 286,000 housing starts to keep up with population growth.
Figure 16. Ontario, Net Demographic-Based Housing Demand by Source and Housing Starts, Number of Units, Last 3 Years
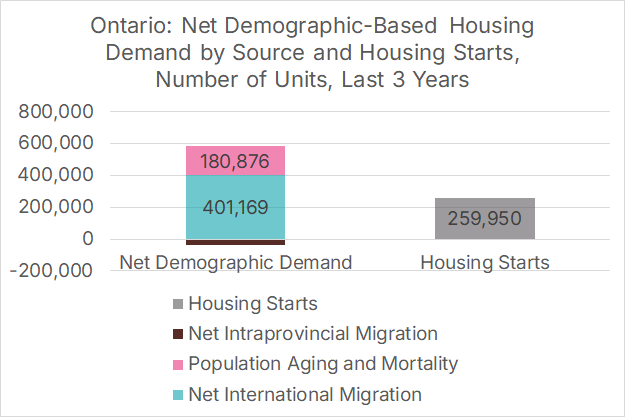
Source: Author’s Calculation from Estimates of the components of demographic growth and Canada Mortgage and Housing Corporation, housing starts.
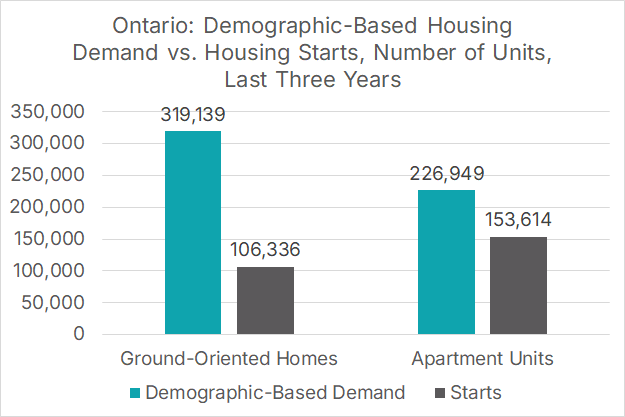
The RoCA Benchmark method allows us to disaggregate demographic-based housing demand into demand for apartment units and demand for ground-oriented homes. Ontario’s apartment construction boom has allowed the province to keep pace with the demographic-based demand for apartments nearly; there has been a massive mismatch in the supply of ground-oriented homes (which includes single-detached, semi-detached, and row/townhouse units) with demographic-based demand. This shortage has led to increasing unaffordability of these homes, increased homelessness, and massive overcrowding, such as 25 international students living in a single home in Brampton.
Figure 17. Ontario, Net Demographic-Based Housing Demand by Source and Housing Starts, Number of Units and Type, Last 3 Years
Source: Author’s Calculation from Estimates of the components of demographic growth and Canada Mortgage and Housing Corporation, housing starts.
Politicians are to blame; newcomers are the victims of the housing crisis, not the cause
There is a human right to housing, which is codified into Canadian law. That right does not depend on your income, your citizenship, or how long you have been in the country. It is not the responsibility of an immigrant from Poland or an international student from Bangladesh to ensure Ontario has a functioning housing market or that the housing supply is keeping up with housing demand. It is the responsibility of our politicians at all three orders of government to ensure that population growth policies are aligned with housing supply policies. They have failed us, along with the higher education sector, who massively increased international student enrollment without any regard for where those students would live or the impact that this would have on local rents and home prices.
Regardless of whether you believe that immigration should be substantially lowered or you believe that Canada should grow to 100 million people by the end of the century, we should all be able to agree that the housing supply, including the supply of family-sized units, must keep up with population growth. It is particularly vital for groups advocating for robust population growth to also be advocating for policy changes to ramp up new housing supply. Given the human right to housing, and given that newcomers are among the biggest victims of housing shortages, increasing population growth without matching increases in housing supply is not pro-immigration; it is pro-exploitation. Population growth advocates should and must do better.