

A Story in Seven Parts: Understanding Eastern Ontario’s Housing Future
Remarks from the 2025 Eastern Ontario Housing Summit

On October 7th, MMI’s Mike Moffatt gave a keynote address 2025 Eastern Ontario Housing Summit, presenting the findings of MMI’s latest report, “Families on the Move: 670,000 More Households in Eastern Ontario by 2051”. The report can be downloaded below:
A number of attendees asked for a copy of the slides, which can be found at the bottom of this page. However, we thought it might also be helpful to include Mike’s speaking notes, found below, which provide the narrative around why Eastern Ontario needs so many more homes. If this format proves useful, we will adopt it for future presentations.
Eastern Ontario requires a significant number of homes to keep pace with population growth and demographic change.
Specifically:
670,000 additional homes needed from 2021-51 across Eastern Ontario’s 15 census divisions.
495,000 ground-oriented homes (single, semi, town, and other low-rise forms).
175,000 apartment units, primarily in urban centres such as Ottawa and Kingston.
Defining the boundaries of Eastern Ontario
We adopt Statistics Canada’s “economic region” classification, which divides Ontario into 11 different economic regions. We use Regions 3, 4, and 5, as shown below, in our conception of Eastern Ontario.
Figure 1. Map of Ontario’s 11 economic regions

Map Source: Greater Niagara Chamber of Commerce. Note that the province of Ontario divides Halton between the Toronto Region and Hamilton-Niagara. Due to data limitations, this report assigns Halton exclusively to the Hamilton-Niagara region.
The Eastern Ontario regions on the map are Ottawa Region (#3), Kingston-Pembroke (#4) and Muskoka-Kawarthas (#5). Statistics Canada divides Halton between the Toronto Region and Hamilton-Niagara. Due to data limitations, we assign Halton exclusively to Hamilton-Niagara.
Figure 2. Ontario’s 11 economic regions by Census Division
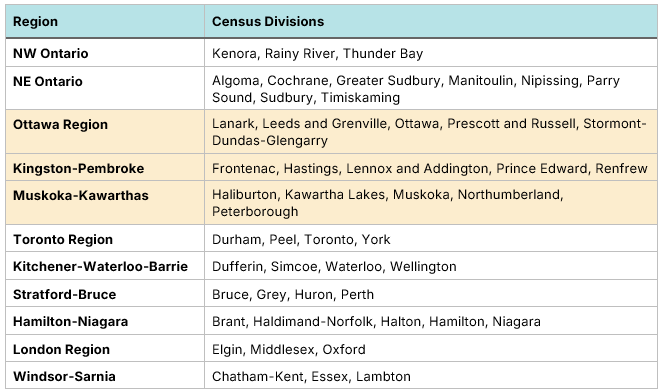
Chart Source: MMI. Note that the province of Ontario divides Halton between the Toronto Region and Hamilton-Niagara. Due to data limitations, this report assigns Halton exclusively to the Hamilton-Niagara region.
Eastern Ontario has grown rapidly in recent years
Since 2015, Eastern Ontario has experienced accelerated population growth, driven by increased permanent-resident immigration (pink), a rise in non-permanent residents (teal), and significant increases in the number of families relocating from other parts of the province (grey).
Figure 3. Population growth by year and source, Eastern Ontario
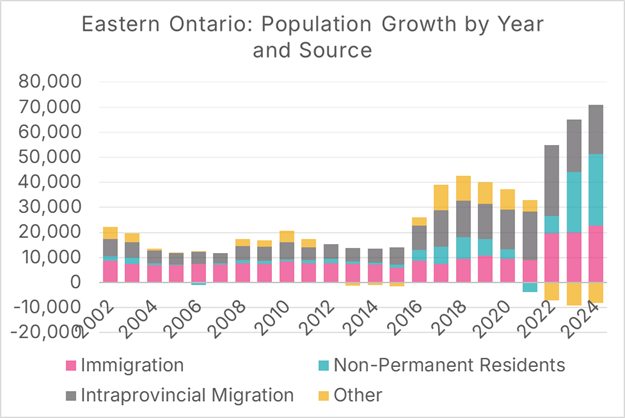
Chart Source: MMI.
Higher growth = an increased need for housing
There are three main reasons why Eastern Ontario’s housing stock must substantially grow through 2051:
Pre-existing shortages.
Population aging and “generational turnover”.
Migration, particularly of families with children from the GTA.
All are important, but policymakers at both the provincial and federal levels are underestimating the third point.
To understand what is driving Eastern Ontario’s growth, we tell a story in seven parts.
1. A province-wide shortage of 500,000 homes as of 2021
Using Census 2021 data, along with version 3.0 of the RoCA Benchmark model, we find that Ontario had a shortage of 500,000 homes as of 2021, with 370,000 of those being in ground-oriented ownership housing.
Figure 4. Ontario housing surplus (+)/shortage (-) by number of units and type, RoCA 3.0 benchmark method, Census 2016 and 2021 data

Data Sources: Census 2016, 2021. Calculation and Chart Source: MMI
2. Up to 2016, this shortage was mostly in Toronto Region (City of Toronto, Peel, York & Durham)
These shortages were not equally distributed across the province. Housing shortages were mostly, but not exclusively, found in the Toronto Region, particularly shortages of ground-oriented ownership housing.
Figure 5. Toronto Region housing surplus (+)/shortage (-) by number of units and type, RoCA 3.0 benchmark method, Census 2016 and 2021 data

Data Sources: Census 2016, 2021. Calculation and Chart Source: MMI
A massive shortage of ground-oriented ownership homes has left families seeking alternatives. In some cases, these families are leaving the Toronto Region entirely; in other cases, they are opting to live in apartment condos instead (which is reflected in the “surplus” figures in Figure 5). In particular, young families, who in other geographies would have moved from an apartment condo to a ground-oriented home, are, for financial reasons, opting to stay in an apartment condo, which requires more of them to be built to satisfy this demand.
3. Ontario’s population grew faster than housing inventory
Prior to 2015, Ontario’s population had been growing by approximately 120,000 persons per year, or 600,000 persons every five years. The province experienced accelerated population growth after 2015, increasing by over one million persons in the pre-pandemic period from 2015 to 2020, and by an additional 1.5 million persons from 2020 to 2025.
This rapid population grow was caused by a surge of non-permanent residents, such as international students and temporary foreign workers, shown in teal on Figure 10, along with an increase in permanent immigration, shown in pink. There was also an in-migration of residents from Alberta after the 2015 oil price crash, which is a component of the “other” category in the 2015-20 data.
Figure 6. Population growth in Ontario, number of persons, by five-year period, by source

Data Sources: Statistics Canada table 17-10-0153-01 and Chart Source: MMI
While apartment unit starts have increased in Ontario in response to population growth and decades of underbuilding, ground-oriented housing starts have fallen over time.
Due to the combination of rapid population growth and the decline in ground-oriented housing starts, the number of ground-oriented housing starts per 100 persons growth in the population increased by over two-thirds from 2005-09 to 2020-24. Between 2005 and 2009, there were 37 ground-oriented housing starts per 100 population increase; by 2020-2024, this figure had fallen to 12.
Figure 7. Housing starts per 100 person increase in population by type and five-year period

Data Sources: Statistics Canada table 17-10-0153-01, CMHC Housing Market Information Portal and Chart Source: MMI
New homes were also not distributed equally across the province. The areas outside of Toronto experienced a seven-times increase in ground-oriented ownership homes compared to the Toronto Region, along with larger increases in ground-oriented rental homes and rental apartments. On the other hand, the Toronto Region’s overall increase in apartments owned by their occupants was twice as high as in the rest of the province.
Figure 8. Change in housing stock by type, by Ontario Region

Data Sources: Census 2016, 2021. Calculation and Chart Source: MMI
Note that the ownership/rental data reflects how the home is used, not whether or not it is a purpose-built rental or a home intended to be owner-occupied.
4. Drive until you qualify
MMI has written extensively on the phenomenon of “drive until you qualify”, which the Canadian Mortgage and Housing Corporation (CMHC) defines as follows:
The expression drive until you qualify has become popular in recent years. It refers to the response households have had to rising home prices. Because of rising prices, many households can’t afford to buy homes in the urban, central sectors of their cities. Households therefore drive further and further… until they find housing they can afford (and a mortgage they can qualify for).
The phenomenon of families leaving the GTA and moving to other parts of the province (known as intraprovincial migration) is not new. Prior to 2014, approximately 20,000 more people, on net, moved out of the Toronto Region to other parts of the province than moved in the other direction. This rate nearly doubled between 2009-14 and 2014-19, with the Region losing 117,577 persons, on net, to other parts of the province in 2009-14, and 217,632 persons in 2014-19. It would nearly double again between 2014-19 and 2019-24, with the Region losing, on net, 359,174 persons to the rest of the province, or more than 70,000 per year.
Figure 9. Net intraprovincial migration by five-year period, Toronto Region

Data Sources: Statistics Canada table 17-10-0153-01 and Chart Source: MMI
Whereas Eastern Ontario has experienced a substantial increase in the net number of persons moving there from other parts of the province.
Figure 10. Net intraprovincial migration by five-year period, Eastern Ontario
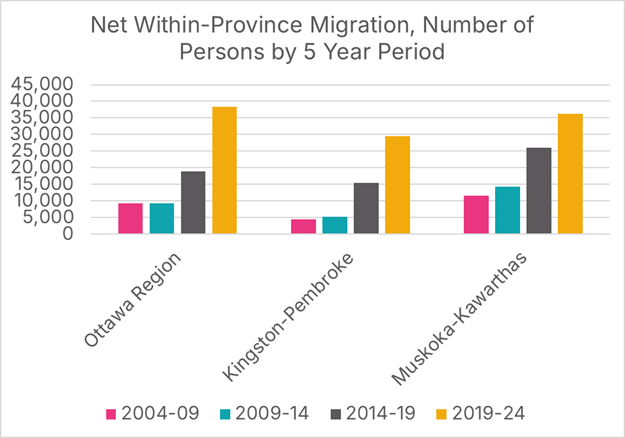
Data Sources: Statistics Canada table 17-10-0153-01 and Chart Source: MMI
The profile of families that leave the GTA for other parts of the province spans age categories, but is disproportionately young families who have, or are about to have, children. Adults between the ages of 25 and 39, and children under the age of 15, account for half of all net intraprovincial migration loss, a ratio that has remained stable throughout the 21st century.
Figure 11. Net intraprovincial migration by five-year period and age, Toronto Region

Data Sources: Statistics Canada table 17-10-0153-01 and Chart Source: MMI
There are numerous reasons why these families choose to leave the GTA and settle in communities such as Peterborough, Kingston, and Ottawa; future reports will examine these factors in greater detail. It is undeniable, however, that shortages of ground-oriented ownership housing in the GTA play a disproportionately large role.
Over three-quarters of couples with children in Ontario live in a ground-oriented ownership home, compared with 52% of all other households. These figures are calculated for a province where ground-oriented ownership housing is in short supply. If there were no shortage, it is almost certain that an even higher proportion of couples with children would live in this form of housing.
Figure 12. Current housing type by family, Census 2021, Ontario

Data Sources: Census 2016, 2021. Calculation and Chart Source: MMI
As with migration patterns, there are numerous reasons why couples with children overwhelmingly choose to live in ground-oriented housing that they own; future research will examine this question. One obvious reason is that families with children typically want homes with three or more bedrooms, and very few apartment units in Ontario meet this standard.
A home with “enough” bedrooms to adequately house a family with children is not a nice-to-have; it is codified in Canadian law under the National Housing Strategy Act as part of Canada’s recognition of the fundamental human right to housing affirmed in international law.
Therefore, it should come as no surprise that, since the Toronto Region is unable or unwilling to build homes that are suitable for couples with children, those couples with children move to communities where those needs can be met.
Figure 13. Proportion of units with three or more bedrooms by unit type, Ontario, Census 2021

Data Sources: Census 2016, 2021. Calculation and Chart Source: MMI
Ontario’s inability to build apartment units with three or more bedrooms is largely a regulatory failure, as outlined in reports such as Impossible Toronto, the Blueprint for More and Better Housing and The Mid-Rise Manual. Recommendation four of this report advocates for regulatory reforms to allow for the construction of attainable three-bedroom homes across various housing typologies, providing families with additional options within the GTA.
Cost also plays a role. Apartment prices in downtown Toronto reached $1,300 a square foot before the pandemic. The number of middle-class couples who are able and willing to pay $1.3 million for a 1,000-square-foot, 3-bedroom condo apartment is vanishingly small, even if zoning and the building code made such units feasible.
Until the cost of building housing in the GTA decreases and reforms are enacted to make building 3-bedroom homes in apartments and missing middle-type housing more practical, families will continue to leave the GTA in increasing numbers, which has already caused the GTA’s housing shortage to become a province-wide crisis.
5. The housing shortage spreads
Despite the stock of ground-oriented ownership homes rising by over 93,000 units between Census 2016 and Census 2021, the RoCA Benchmark v3.0 model finds that the rest of the province went from having a modest surplus of ground-oriented ownership homes in 2016 to an over 70,000 unit deficit by 2021. Some of this was due to ownership housing getting transferred to the rental market, as shown in Figure 24. The shortage of rental apartments increased, while the shortage of apartments occupied by their owners went relatively unchanged.
Figure 14. Ontario outside of the Toronto Region housing surplus (+)/shortage (-) by number of units and type, RoCA 3.0 benchmark method, Census 2016 and 2021 data

Data Sources: Census 2016, 2021. Calculation and Chart Source: MMI
6. The GTA cannot grow as fast as the Ministry of Finance projects
Estimating future housing needs at the census division level using the RoCA Benchmark v3.0 method and the Ontario Ministry of Finance’s population projections is a relatively straightforward exercise. Please refer to the RoCA (Rest of Canada Average) Benchmark v3.0 manual for the methodology.
To simplify the analysis, we categorize housing types into two groups: ground-oriented and apartment units. We dispense with the “ownership” vs. “rental” distinction for our forward-looking analysis, as the goal is to ensure that enough homes of each type are built. Other policies can be implemented if too many homes are entering the rental market versus being occupied by their owners, or vice versa.
Not surprisingly, the Toronto Region has the highest projected 30-year need for ground-oriented homes, as it has the largest population of any of the regions, and also has the largest pre-existing shortage.
Figure 15. Demographic-based demand for ground-oriented homes, both ownership and rental, 2021-51, by Ontario Region

Data Sources: Census 2016, 2021. Calculation and Chart Source: MMI
A need to increase the Toronto Region’s stock of ground-oriented housing by 940,000 units should ring alarm bells, when the Region’s stock of these homes only increased by 50,000 units between 2016 and 2021, and only 13,000 of those were occupied by their owners. At 2016-21 ground-oriented build rates, it would take the Toronto Region 93 years to create that 30-year supply of homes. If anything, this estimate underestimates the extent of the challenge, as ground-oriented housing starts have continued to fall in the Region since 2021.
The Toronto Region needs to increase the pace of ground-oriented housing stock growth by 209%. Given the declines in ground-oriented housing stock growth in this Region over the past two decades, a limited lack of development land due to natural constraints, urban growth boundaries, and the Greenbelt, such an increase is highly impractical, if not impossible.
In our view, the exercise of forecasting future housing demand has shown that the Ministry of Finance’s population projections will not hold. The Greater Toronto Area will experience greater outmigration than what is captured in the Ministry’s projections, and other areas of the province will experience an influx of couples with children looking for family-friendly, ground-oriented housing that they can afford.
7. 2021-51 Housing Needs Estimates
Due to the improbability, if not outright impossibility, of Toronto building enough ground-oriented housing to meet the needs of families, it is necessary to increase the forecast of the number of families who will relocate from the GTA to other parts of the province.
Doing so yields the following housing needs estimates by Economic Region, which incorporates pre-existing shortages, projected demographic change and population growth, and accelerated “drive until you qualify” migration out of the Toronto Region.
Figure 16. 30-year demand projection by housing type and Region, incorporating both pre-existing shortages and “drive until you qualify” adjustment
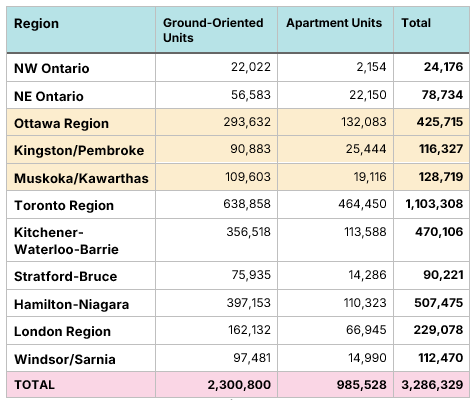
Data Sources: Census 2016, 2021. Calculation and Chart Source: MMI
Our final thoughts
Current planning takes into account a number of factors, including:
Generational turnover
“Linear” population projections
But imperfectly captures others:
Pre-existing housing shortages
The types of units that are needed
Future changes to migration patterns
When incorporating those imperfectly captured factors, we find that Eastern Ontario will grow larger and faster than planners predict.
A copy of the presentation slides in PDF format can be downloaded from the link below