

A Symptom of Scarcity: What the Growth of Ground-Oriented Rentals Tells Us
College towns and big cities alike are seeing the same story: homes once owned are now leased

Highlights
Ground-oriented rentals becoming more common: In 2016, 12.4% of ground-oriented homes (single-detached, semi-detached, and townhomes) were occupied by residents who did not own the home. By 2021, this ratio had increased to 13.5%, reflecting both the increased construction of rental housing and investors buying homes and renting them out.
Rentals were disproportionately a Western Canada and college town phenomenon: In 2016, renting a ground-oriented home was more common in Western Canada than in Atlantic Canada or Quebec. In Ontario, communities such as London and Kitchener-Waterloo had a higher proportion of ground-oriented rentals, reflecting large student populations, while the GTA was below average.
Ontario caught up quickly in recent years: The proportion of ground-oriented housing occupied by renters increased virtually everywhere, but the increases were more pronounced in Ontario college towns as well as the GTA.
The best predictor of the 2016-21 shift to ground-oriented rentals is pre-existing housing shortages: While population growth does explain (in a statistical sense) much of the growth of ground-oriented rental housing, the strongest correlations are between where ground-oriented rental stock grew the fastest and where there were pre-existing housing shortages (as of 2016), which is suggestive of investors recognizing the scarcity of housing in particular communities, and purchasing the home to achieve long-run capital gains. There is a multi-collinearity issue, however, as places with pre-existing housing shortages were also more likely to experience stronger population growth, as those communities tend to attract an outsized proportion of newcomers to Canada. Further study is warranted.
The shift towards more ground-oriented rental housing
The recent MMI report, Families on the Move: 670,000 More Households in Eastern Ontario by 2051, on housing dynamics in Eastern Ontario, generated a large number of thoughtful comments and questions from readers, particularly relating to the rapid increase in ground-oriented housing (which covers single-detached, semi-detached, and townhomes/rowhomes). The unusually rapid growth of ground-oriented rental options and the lack of new ownership options in the GTA, as shown in Figure 1, have made it incredibly challenging for families with children in the GTA to find an attainable, family-sized home they can own.
Figure 1. Change in housing stock by type, by Ontario Region

Source: Families on the Move: 670,000 More Households in Eastern Ontario by 2051
Having more rental options, by itself, is a wonderful thing. MMI’s vision of a successful housing system for Canada’s young, urban middle class requires robust ownership and rental options:
Missing Middle Initiative’s North Star: A Canada where every middle-class individual or family, in every city, has a high-quality of life and access to both market-rate rental and market-rate ownership housing options that are affordable, adequate, suitable, resilient, and climate-friendly.
While an increase in rental options is beneficial, the lack of growth in ownership options is not. And, unfortunately, the two phenomena are not unrelated, as most of the growth in rental options came from investors buying either new or pre-existing homes intended for the ownership market, and renting them out.
Given the high level of reader interest, a further examination of this shift from ownership to rental is warranted. To start, let’s expand our examination beyond Ontario and examine Canada’s 27 largest Census Divisions, which account for nearly two-thirds of Canada’s population.
In 2016, 12.4% of all ground-oriented homes were occupied by a renter who did not own the property, as shown in Figure 2, which includes both purpose-built rentals and homes owned by an investor and then rented out. Ground-oriented rentals were less common in our 27 large communities (11.9% of all ground-oriented stock), than in smaller communities (11.9%).
Figure 2. Ground-oriented housing units by Census Division and tenure, Census 2016
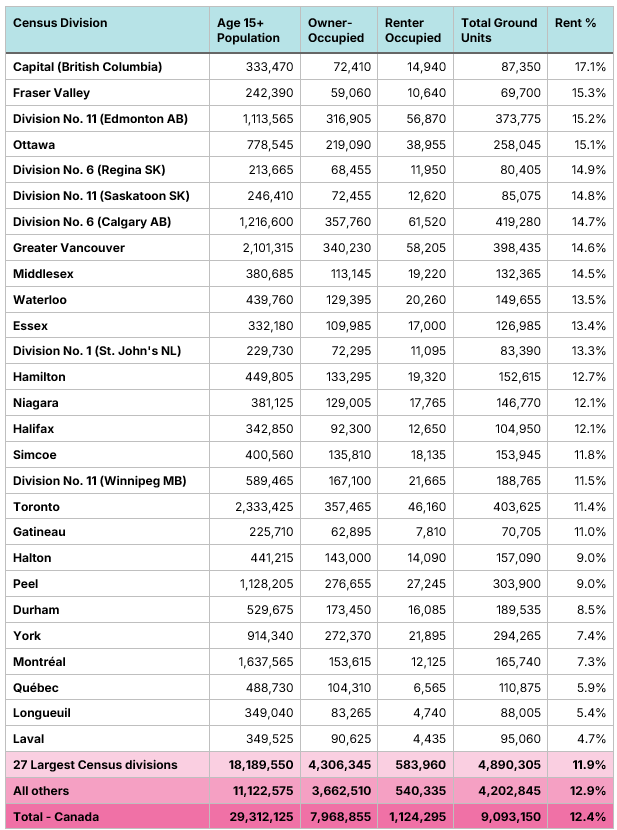
Data Sources: Census 2016, 2021. Chart Source: MMI
The is a substantial geographic variation in where these rental homes were located in 2016, with rentals making up a far larger share in Western Canada, particularly British Columbia, than in Eastern Canada, with Quebec in particular having low rates. Not surprisingly, ground-oriented rental housing is far more common in Ontario college towns such as London and Waterloo, as the phenomenon of investors buying single-family homes and renting them to students is well known. Ottawa tops the list for Ontario cities, while the GTA Census Divisions of Toronto, Halton, Peel, Durham, and York were all below the Canadian average.
Fast-forwarding to Census 2021, we find that the proportion of ground-oriented homes used as rentals increased in every single one of our 27 Census Divisions, as shown in Figure 3, indicative of a Canada-wide trend. This trend, however, was particularly profound in Ontario, with 10 of 12 Census Divisions experiencing a two percentage point or higher increase in the proportion of ground-oriented rentals. In contrast, only 1 of 15 non-Ontario communities experienced this level of growth; the Greater Vancouver Area was the sole outlier.
Figure 3. Ground-oriented housing units by Census Division and tenure, Census 2021
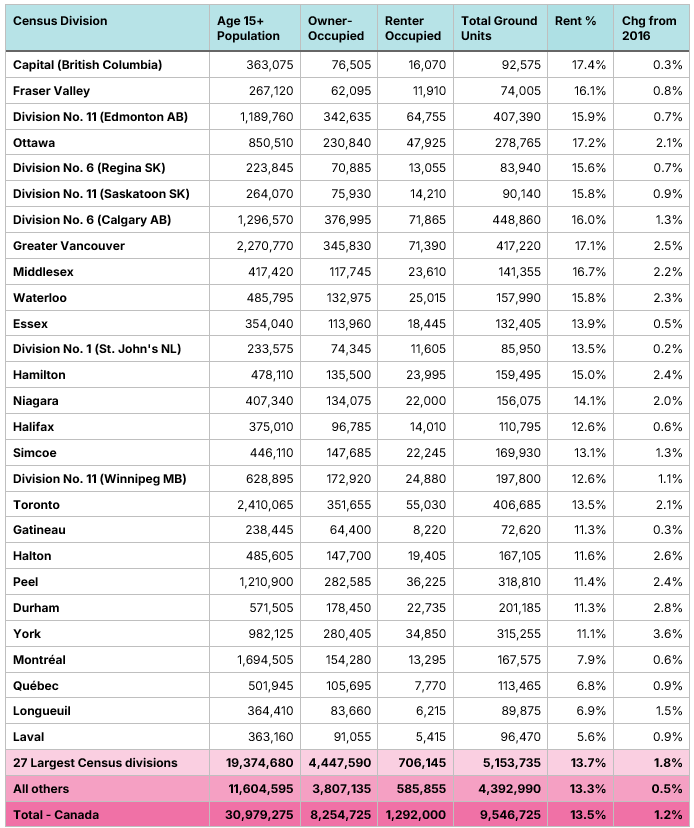
Data Sources: Census 2016, 2021. Chart Source: MMI
The growth in the shift to rental was particularly pronounced in GTA communities outside of the City of Toronto, with York, Durham, Halton, and Peel, joining Greater Vancouver in the Top 5. The GTA communities are still below the Canadian average when it comes to the proportion of ground-oriented homes that are used as rentals, but they are quickly converging to the mean. Middlesex (London) and Waterloo also ranked highly, which is not surprising, given the rapid growth in student populations in recent years.
Figure 4 shows the change in the stock of ground-oriented rental and ownership homes between 2016 and 2021. In the City of Toronto, the stock of ground-oriented ownership housing actually fell between 2016 and 2021, as investor purchases of ground-oriented homes to rent exceeded the overall increase in the stock of ground-oriented homes.
Figure 4. Absolute change in population and ground units by tenure, Census 2016 vs. 2021
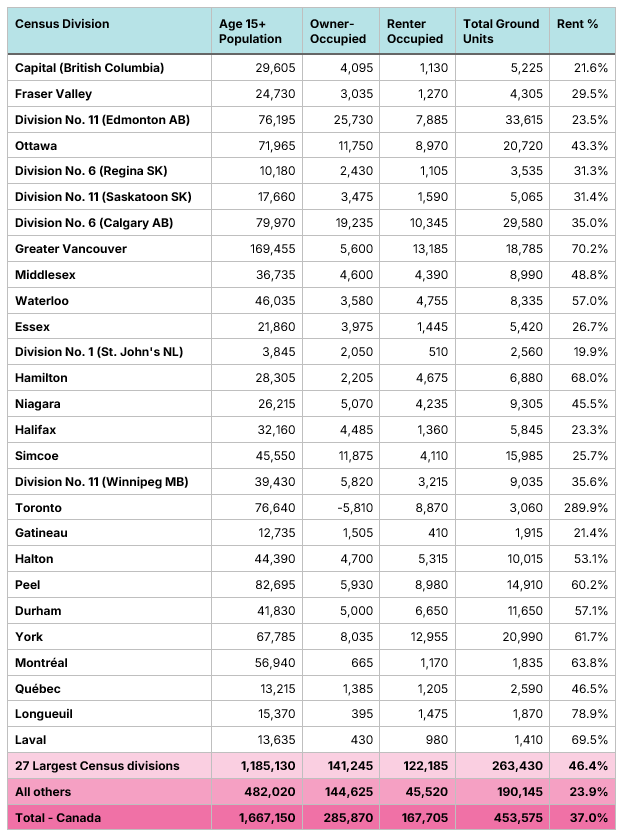
Data Sources: Census 2016, 2021. Chart Source: MMI
Figure 5 lists the percentage growth rates of the Age 15+ population and the stock of ground-oriented housing between 2016 and 2021, along with the estimated total housing surplus or shortage, using the RoCA Benchmark 3.0 method, for each Census Division per 1000 residents aged 15+, as of 2016; refer to RoCA Benchmark 3.0 Model: A method to forecast local housing needs for methodological details.
Figure 5. Growth rate in ground units by tenure, Census 2016 vs. 2021, and 2016 pre-existing housing shortages, number of units, per 1000 15+ year olds, RoCA Benchmark 3.0 Method
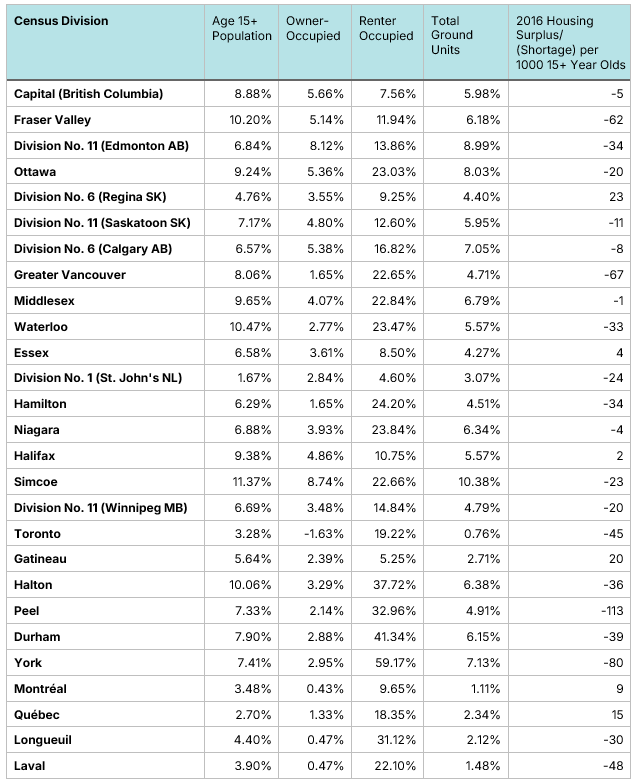
Data Sources: Census 2016, 2021. Chart Source: MMI
Using the data from Figure 5, we ran a simple correlation analysis between the percentage growth in ground-oriented rental housing and the other variables. Between 2016 and 2021, ground-oriented rental housing growth was positively correlated with population growth (correlation coefficient of 0.25) and negatively correlated with the growth in ground-oriented ownership housing (-0.16), reflecting investors buying up homes and converting them to rentals. By far, the strongest correlation in absolute terms was with 2016 housing surpluses (-0.62), indicating that ground-oriented housing stock increases were more prevalent in places that had pre-existing housing shortages.
A simple correlation examination is no replacement for a detailed study; these results certainly support the idea that pre-existing housing shortages were an important driver in investors buying up existing homes and converting them to rentals.
To download a PDF of this article, click on the link below