

Canada vs. the World: The Worst Record on Housing Affordability Since 2004
Among 23 OECD nations, Canada stands alone in how far affordability has fallen.

Highlights
Canada leads the OECD in housing affordability deterioration since 2004: Across 23 countries with available OECD data, Canada experienced the sharpest rise in the home-price-to-income ratio, up more than 80% over the past two decades.
A home that cost three years’ income in 2004 now costs nearly five and a half today: A combination of skyrocketing home prices and stagnant wage growth has left Canadian households far worse off than their peers abroad.
Affordability trends diverged sharply after 2004: While Canada’s home price-to-income ratio grew by over 80%, other countries often cited for having unaffordable housing, such as the United States, the United Kingdom, and Spain, have not experienced the same level of price-to-income growth.
Regional divides within Canada mirror global ones: Over the past 20 years, home price affordability has deteriorated significantly more in Kitchener-Waterloo than in Edmonton. If communities within a country can differ, it should come as no surprise that the same would hold across countries.
The housing crisis isn’t the same everywhere; it has a distinctly maple-flavoured character: OECD data shows that five countries in our 13-country sample have improved their affordability since 2019, underscoring that Canada’s experience stems from policy choices, not a global inevitability.
Housing affordability has deteriorated at different rates across Canada; why would that not hold for the world?
Housing affordability and the deterioration of housing affordability differ greatly across Canada. For example, as detailed in the article "Can Homes Become Affordable Without Prices Going Down?", housing affordability, as defined by the price-to-income ratio of a single-family home, was roughly equivalent in 2005, with price-to-income ratios of 3.28 and 3.02, respectively, in Kitchener-Waterloo and Edmonton. However, by 2024, the two markets had little in common, with Kitchener-Waterloo’s price-to-income ratio increasing by 123%, to 7.33 (that is, the price of a home in Kitchener-Waterloo is 7.3 times the pre-tax income of a middle-class couple), whereas Edmonton’s increase was a more modest 34%, to 4.06. While prices rising 34% more than income is a significant deterioration in affordability, it is nowhere near the crisis experienced in Kitchener-Waterloo and other southern Ontario markets.
This cross-Canada comparison of housing affordability raises an obvious question: “Does the same deviations in affordability hold across countries?” This question can be answered with the OECD’s housing price-to-income data series. The data does come with challenges; although the data set goes back to 1960, the start (and end) of the data series differs by country. Additionally, the data is presented as an index (2015 = 100), rather than a price-to-income ratio, so it can only indicate how affordability changed over time, relative to absolute levels. Despite those limitations, it provides valuable insights into the changing face of housing affordability across OECD countries.
There are 13 OECD countries in the dataset, including Canada, that have complete data spanning 1979 through 2024, providing a useful set of countries to compare with Canada. Figure 1 shows that Canada had the second-highest deterioration in housing affordability among the countries in the group, behind only Australia. Price-to-income ratios rose by 109% in this period, meaning that if it took three years to purchase a home in 1979 with 1979-level wages, it would now take six years of 2024-level wages to purchase a home in 2024.
Interestingly, the price-to-income ratio in the United States fell slightly over the past 45 years, highlighting the substantial differences in affordability trends between the two countries.
Figure 1: Change in home-price-to-income ratios, 1979-2024.
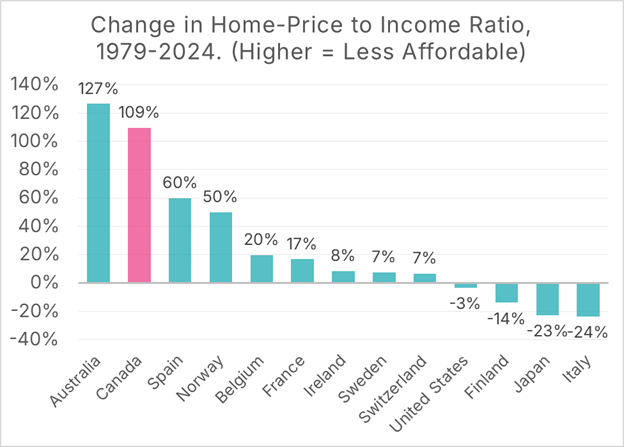
Data Source: OECD Home Price-to-Income Ratio, Chart Source: MMI
These types of exercises are often highly dependent on the choice of start points and end points, and, aside from a Smashing Pumpkins song, there is nothing particularly special about 1979. Suppose we narrow our focus to the last five years. In that case, Canada’s deterioration in affordability is only the fourth-worst among our eleven countries, with Australia, the United States, and Switzerland all experiencing larger increases in the price-to-income ratio. On the other hand, five of our 13 countries experienced increased affordability over the last five years, showing that the story is far more complex than “homes got more expensive everywhere”.
Figure 2: Change in home-price-to-income ratios, 2019-2024.
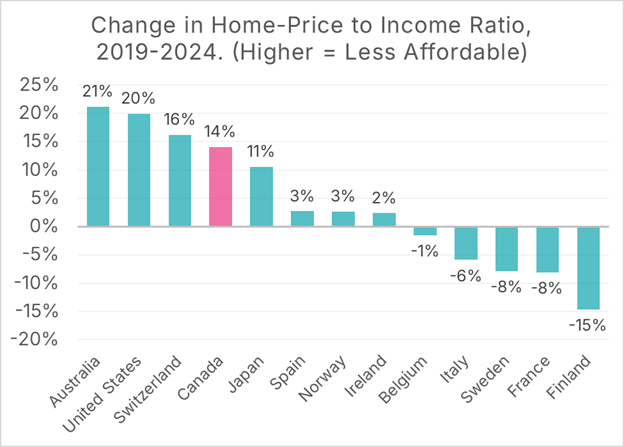
Data Source: OECD Home Price-to-Income Ratio, Chart Source: MMI
If we extend our window to the last ten years, Canada’s deterioration in affordability is head-and-shoulders above the other 12 countries, as price-to-income ratios have risen by 40%. For context, the increases in the 2014-19 period are also included, which show that the price-to-income ratio increases in Canada and Ireland are significantly higher than those in other countries, with Sweden’s also being quite high. Spain, a country where home price increases have received considerable attention over the past decade, experienced an over 10% rise in price-to-income ratios from 2014 to 2019, high but well behind the other three countries.
Figure 3: Change in home-price-to-income ratios, 2019-2024.
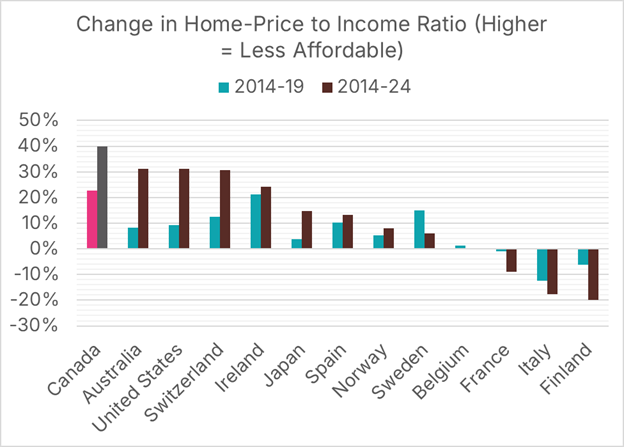
Data Source: OECD Home Price-to-Income Ratio, Chart Source: MMI
Increasing our sample to 15 years, Canada remains #1 for affordability deterioration, with a nearly 60% rise in price-to-income ratios during this period. The data for Ireland, Spain, Italy, and the United States highlight the impact of the Great Financial Crisis, during which home prices fell faster than incomes; a silver lining to a disastrous event.
Figure 4: Change in home-price-to-income ratios, 2009-2024.
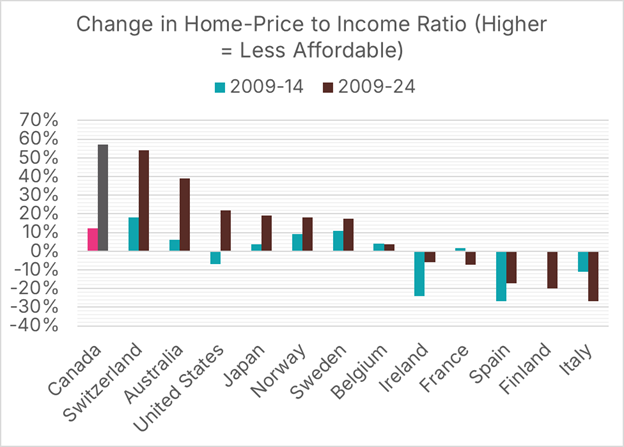
Data Source: OECD Home Price-to-Income Ratio, Chart Source: MMI
If we go back to 2004, the year Mike bought his first home, Canada remains at the top, with a home price-to-income ratio increase of over 80%. A home that was priced at 3 times income in 2004 would have a price in 2024 of nearly 5.5 times a family’s 2024 income. And they would not get much relief from mortgage rates, as they are only somewhat lower today than they were back then.
Figure 5: Change in home-price-to-income ratios, 2004-2024.
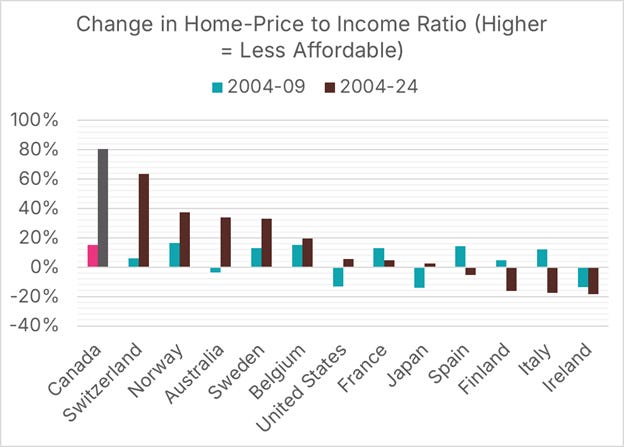
Data Source: OECD Home Price-to-Income Ratio, Chart Source: MMI
Given that our sample only includes 13 countries, it is worthwhile to examine what happens if we expand our data set beyond those with complete data from 1979 to 2024. Loosening the requirements adds 10 additional countries to the mix, but with no meaningful change in results. Canada remains #1 in terms of decreased affordability, and Switzerland remains #2.
Figure 6: Change in home-price-to-income ratios, 2004-2024.
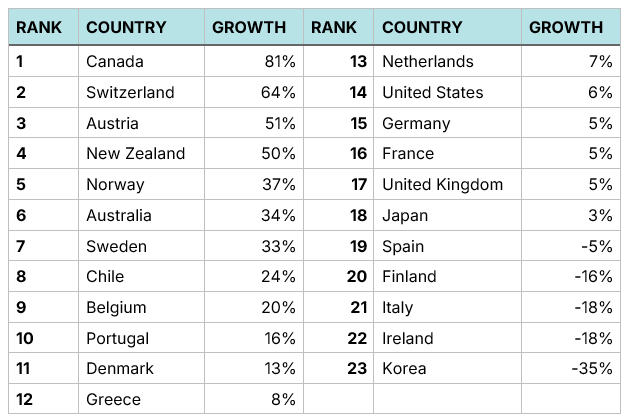
Data Source: OECD Home Price-to-Income Ratio, Chart Source: MMI
Recall, however, that Canada was only second for decreased affordability from 1979 to 2024, well behind Australia, despite Canada being much farther ahead from 2004 to 2024. Figure 7, which presents a time series of affordability changes from 1979 to 2024 for Australia, Canada, Ireland, and the United States, indicates that Australia experienced a significant price increase in the early 2000s, substantially larger than the one experienced by Canada. As well, Canada’s 1990 home price crash and subsequent price stagnation was more pronounced than the one experienced in Australia.
Figure 7: Change in home-price-to-income ratios, 1979-2024.
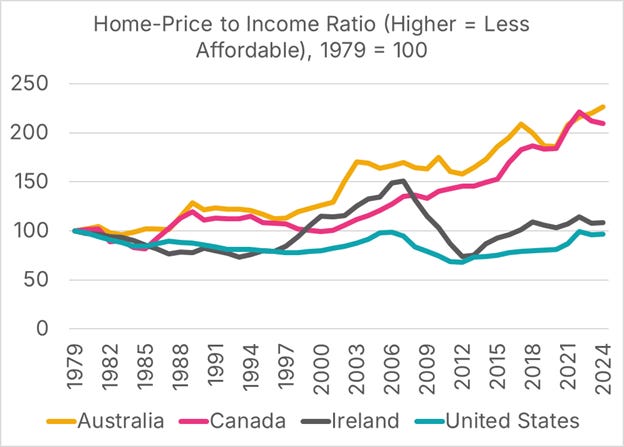
Data Source: OECD Home Price-to-Income Ratio, Chart Source: MMI
This effect can be illustrated by examining changes in price-to-income ratios by 10-year period. Australia experienced a significant increase in the home price-to-income ratio between 1994 and 2004, whereas Canada’s remained virtually unchanged. The reverse holds for the period from 2004 to 2014, during which Canada experienced a significant deterioration in affordability, whereas Australia remained relatively unchanged.
Figure 8: Change in home-price-to-income ratios by 10-year periods.
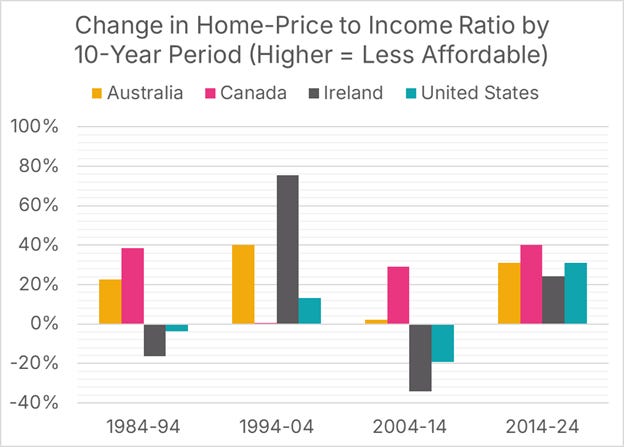
Data Source: OECD Home Price-to-Income Ratio, Chart Source: MMI
In short, the experience between countries is similar to the experience within Canada; however, there are substantial differences in housing affordability trends. It is simply untrue to claim that Canada’s deterioration in housing affordability is roughly the same as everywhere; ours is far worse than most over most time scales, and many countries have experienced an improvement in affordability in recent decades. Finally, we cannot forget that housing affordability is a function of both the price of the home and the level of family incomes, and Canada’s relatively stagnant wage growth over the past 45 years is an important part of the story.