

Communities are Unprepared for the Exodus of Urban Families
Lanark as a Case Study

Highlights
For the last decade, communities in Ontario have underforecasted population growth.
These under forecasts cause home prices to be higher than they would be through higher land prices (caused by not preparing for enough density or development land) and higher development charges (caused by the DC calculation formula).
In communities like those in Lanark County, almost all population growth occurs from people moving in from other parts of the province, mostly Ottawa, rather than through immigration or non-permanent residency.
New residents are disproportionately young families looking for affordable family-sized housing and late-career professionals “cashing out” of more expensive urban properties. Both groups are drawn to Lanark because of its high quality of life.
Because of these migration patterns, forecasting Lanark’s future population growth is essentially forecasting the City of Ottawa’s ability to meet future demand for attainable family-sized housing.
In fact, the City of Ottawa is not even trying to meet that future demand by setting municipal housing targets well below provincial ones.
Planners should recognize where housing demand is coming from when planning, factors that could alter that demand, along with pre-existing housing shortages.
One of the more underexplored dynamics of Canadian housing is the growth in the number of families that have moved out of large municipalities to surrounding smaller communities. And when the subject of the urban exodus does come up in Ontario, it’s typically in the context of young families moving out of the Greater Toronto Area to communities like Brantford or Whitby. However, this dynamic is occurring in other parts of the province, including in the Ottawa Region. This influx of new residents brings opportunities, but it also creates strains on infrastructure and affordability, particularly if communities leave themselves unprepared.
Lanark Census Division as a Case Study
Lanark Census Division is a collection of communities southwest of Ottawa. It is comprised of the upper-tier County of Lanark, nine lower-tier municipalities1 under the upper-tier government, and the Town of Smiths Falls, which is a single-tier municipality which is administratively separate from the County.
Figure 1: City of Ottawa and Lanark Census Division on a Map of Southern Ontario

Lanark Census Division experienced modest population growth over the first part of the decade, growing from 65,000 residents in 2001 to 69,500 in 2015, an average annual growth of 325 new residents. Since then, the region has experienced a population boom, exceeding 83,500 total residents by Canada Day 20242, an annual average growth of 1,550 residents a year for nine years.
Figure 2. Population Change in Lanark Census Division by Year, Number of Residents, July 1 to June 30 Each Year
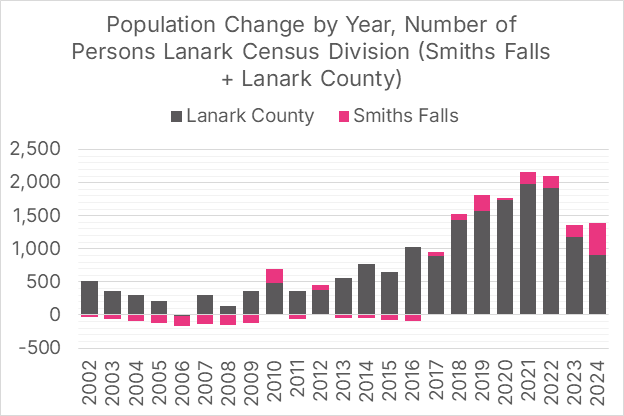
Sources: Statistics Canada tables 17-10-0152-01 and 17-10-0155-01.
Of that 1,550 average annual population growth in Lanark Census Division, 1400 of that occurred in Lanark County, with the remaining 150 in Smiths Falls.
Across the province, the overwhelming majority of net population growth in recent years has come from a combination of immigration and a growing number of non-permanent residents. That is not the case in Lanark, where population growth from these sources has been negligible and offset by Canadians emigrating to other countries. Nor is population growth coming from a baby boom; in fact, like in many parts of Canada deaths typically exceed births. Almost all of Lanark Census Division’s3 net population growth has come from more people moving in from other parts of Canada than from moving out (domestic migration). Lanark’s recent population boom has come from an increase in the number of families moving in from other parts of Canada.
Figure 3. Components of Population Growth for Lanark Census Division, Number of Persons by Year

Source: Statistics Canada Table 17-10-0153-01.
In most years in Lanark, the only two noteworthy components of net population growth are domestic migration and “residual deviation,” which is unaccounted-for population growth. This dynamic becomes clearer when examining the last nine years of population growth, where over 100% of the 14,000 net rise in population comes from either domestic migration or residual deviation.
Figure 4. Components of Population Growth for Lanark Census Division, Number of Persons

Source: Statistics Canada Table 17-10-0153-01.
The Statistics Canada series Components of population change by census division allows us to break the data down by age. It shows that for Lanark Census Division, the largest group moving in are young families, with adults in their late 20s to mid-30s, along with pre-school-aged children. There are also significant numbers of later career professionals around the age of 55.
Figure 5. Population Growth by Age from Net Domestic Migration and Residual Deviation

Source: Statistics Canada Table 17-10-0153-01.
The table also reveals that almost all the domestic migration for Lanark Census Division comes from people moving in from other parts of Ontario. The data does not reveal where they came from, but an older data set for Carleton Place, Mississippi Mills and Beckwith reveals that the majority of people moving in are either from the City of Ottawa or other towns in the Ottawa Region.
Overall, the Statistics Canada data can tell us how many people are moving to Lanark, but it cannot reveal their motivations. Anecdotally, it would appear the primary motivator for young families revolves around quality of life and availability of ground-oriented family-sized homes. For older career professionals, it is often the ability to “cash out” of more expensive properties in the City of Ottawa and obtain larger properties with fewer of the downsides associated with city life.
It is uncertain how much of Lanark’s population increase was due to rising Ottawa home prices, but there is no question that it played a role. Both home prices and Lanark’s population began growing a few years before the pandemic, then escalated during the pandemic in an era of low interest rates coupled with increased numbers of adults working from home, allowing them to live further from their workplace.
Figure 6. Ottawa Home Prices and Lanark Census Division Population

Sources: Statistics Canada tables 17-10-0152-01 and 17-10-0155-01, and the Canadian Real Estate Association.
Planners Did Not See This Growth Coming
The population forecasts that underpinned Lanark County’s 2012 Official Plan did a reasonable job of forecasting the County’s population growth between Census 2011 and 2016. It failed, however, to anticipate the population growth that would occur after 2016.
Figure 7. Ottawa Home Prices and Lanark Census Division Population

Sources: Lanark County 2012 Official Plan, Census 2016, Census 2021.
Noting that past growth was higher than the “high” forecast is not intended as a critique of the abilities of this forecaster, particularly as this miss was smaller than in many communities in Ontario; the report Forecast for Failure chronicles the two-decade-long issues with population projections in the Greater Toronto Area. However, like almost all population forecasters working with planners, this one created “low” and “high” forecasts that were not sufficiently differentiated from the medium scenario. No indication was given of what these scenarios represent; does the “high” scenario represent a 70th percentile outcome? 80th? 95th? These projections can lead municipal governments into a false sense of certainty about what is in store for the next 5-10 years.
In short, population forecasts prepared for municipalities commonly fail, and this has real-world consequences.
Consequences of Underforecasting Population Growth
An influx of young families into smaller communities can be incredibly beneficial, bringing new energy and new customers to local businesses. But communities also must be prepared for that growth, as those incoming families require a host of services.
The biggest impact, however, is on home prices. Municipalities set the amount of land available for development and the level of permitted density based on population forecasts. Should the population rise faster than anticipated, then you have more people needing to live on the same (limited) piece of land, which causes land prices, and therefore home prices, to rise faster than they otherwise would have.
Similarly, development charge rates are set by a formula that incorporates future population growth. This population growth factor is set as part of the denominator of the formula, so increasing population growth projections caused development charge rates to fall. If population growth forecasts are set too low, then development charges will be set at an excessively high rate. These development charges are passed along to the final homebuyer, causing new home prices to be higher than they otherwise would be.
Will These Population Underforecasts Continue?
Quite possibly, though, communities are taking an active role in trying to prevent that. The Draft Report of Lanark County’s Growth Management Strategy, prepared in November 2024, is in line with the county's recent population growth.
Figure 8. Average Annual Population Change, Lanark County, Actual and Forecasted
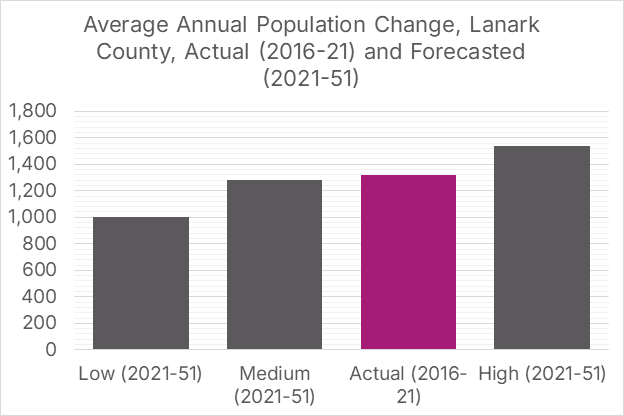
Sources: Draft Report, Census 2016, Census 2021.
The draft report's population projections are also in line with recent projections prepared by Ontario’s Ministry of Finance.
These population projections all implicitly assume that the City of Ottawa’s shortage of attainable family-sized housing does not get significantly worse (or significantly better). If the shortage continues to grow, then communities in Lanark will experience even higher volumes of families seeking attainable family-sized housing and a high quality of life. However, suppose more family-sized homes are built in the City of Ottawa. In that case, the landscape becomes more competitive, and Lanark may not continue to see as many young families move to the community.
In short, forecasting Lanark’s population growth is largely forecasting the City of Ottawa’s ability to address its shortage of family-sized homes.
Ottawa’s Homebuilding Fails to Keep Pace
Unlike many other parts of Ontario, ground-oriented housing starts, which include single-detached, semi-detached, and row homes, were able to scale up after 2015 in response to increased demand. These starts peaked in 2021 at 5,613 units and have declined considerably since then. Apartment unit starts, which includes both purpose-built rental and condo units, significantly and steadily increased from 2019 to 2023, before declining considerably in 2024 due to reduced demand in the condominium market.
Figure 9. City of Ottawa Housing Starts by Year and Type of Home

Source: CMHC Housing Market Information Portal.
Adding together both types of housing starts, Ottawa has only once this century exceeded 10,000 annual housing starts, and in 2024, it reached only 6,800. Yet the provincial government has set an annual average target of 15,100 units for the City, a figure they see as necessary to address the housing crisis.
Figure 10. City of Ottawa Housing Starts by Year and Type of Home. Provincial Average Annual Target = 15,100 Units a Year

Source: CMHC Housing Market Information Portal.
Recent changes to immigration targets and non-permanent residency programs will impact the demand for housing in Ottawa, which will have trickle-down impacts on Lanark Census Division. However, there is still a substantial shortage of housing in the City of Ottawa, and the City looks to be nowhere near approaching its provincial housing targets.
There are no guarantees in life, but it does not appear that Ottawa will soon be building enough family-sized housing. This would mean continued and increasing demand for family-sized homes in Lanark.
In Fact, Ottawa Isn’t Even Trying to Keep Pace
Although the provincial government set a housing start target of 151,000 units over 10 years, this target has not been implemented in any of the City’s planning documents.
The City’s August 2024 Development Charges Amendment Background Study shows annual housing start figures just over half of the provincial targets. This matters, as setting a target too low causes cities not to legalize enough density, not open up enough land for development, and keep development charges (DCs) artificially high due to the DC calculation formula.
Figure 11. Housing Starts: Provincial Plan for the City of Ottawa vs. the City of Ottawa’s Own Plan by Year

Sources: CMHC Housing Market Information Portal, Development Charges Amendment Background Study.
It is not just a DC background study that has future housing starts much lower than the provincial target. Lower targets permeate through all of the City of Ottawa’s official planning documents, including the City’s Greenfield Residential Land Survey of February 2024.
The City of Ottawa plans for housing growth to lag behind provincial targets and population growth. This will cause an increasing number of families to choose to live in Lanark rather than Ottawa. However, Lanark is failing to incorporate the City of Ottawa’s future housing shortages and this migration dynamic into its planning.
Finally, Analysts Shouldn’t Forget About Existing Shortages
In documents such as the Draft Report, analysts forecast future population growth and convert this into the number of additional homes that the community will need. This analysis, however, assumes that the community currently has no pre-existing housing shortages.
Like much of Southern Ontario, Lanark has significant pre-existing housing shortages. In the report Ontario’s Need for 1.5 Million Homes: An Update, we find that Census 2021 data reveals substantial housing shortages in the City of Ottawa and every Census Division bordering Ottawa.
Figure 12. Housing Shortage by Census Division, Estimated using the RoCA Benchmark 1.0 Method, Census 2021 Data
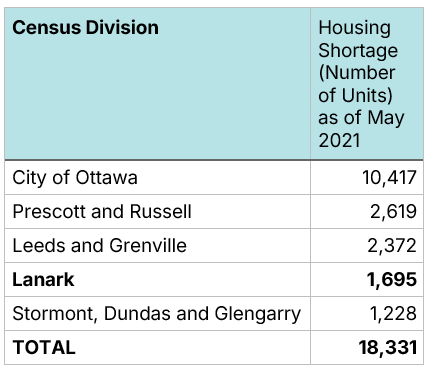
Source: Ontario’s Need for 1.5 Million Homes: An Update
Putting It All Together
The towns that comprise Lanark County are not dissimilar to many communities in Ontario that are proximate to larger cities with housing shortages. They offer a high quality of life and relatively attainable housing for young families and later-career professionals. These communities have, in the past, underestimated their attractiveness to these families, which has caused them to under-forecast population growth. This failure to forecast causes home prices to be higher than they otherwise would be. They risk making the same mistakes in the future if they fail to account for future population growth or fail to address pre-existing housing shortages in their planning.
Download a PDF version of this article below:
Beckwith, Carleton Place, Drummond/North Elmsley, Lanark Highlands, Mississippi Mills, Montague, Perth, Smiths Falls, and Tay Valley.
In the figure, “2024” refers to population change between July 1, 2023 and July 1, 2024.
This data is unavailable at the Census subdivision level, so we cannot break it into Lanark County and Smiths Falls components.