

In 2005, There Were 41 Communities Where a Middle-Class Family Could Afford to Buy a Home. Today, There's Only Nine
A WHAM score investigation into middle-class housing affordability

Highlights
WHAM scores measure the number of weeks of pre-tax income needed to save for a 20% downpayment for a home and the first five years of mortgage payments, taking into account 5-year fixed mortgage rates, wages, and home prices.
WHAM scores above 150 are classified as “unaffordable” for middle-class families.
In 2005, only nine of the 51 Canadian markets had WHAM scores above 150 for single-family homes; today, 41 of 51 do.
A couple of weeks ago, we introduced our Weekly Housing Affordability Metric (WHAM) and showed how housing affordability has changed over time in Winnipeg, Edmonton, and London, Ontario. Naturally, readers wanted to know what the situation looked like in their city, so let’s take a look.
A WHAM score measures the number of weeks of pre-tax income needed to save for a 20% downpayment for a home and the first five years of mortgage payments, taking into account 5-year fixed mortgage rates, the median weekly wage in a province for 25-to-54-year-olds, and home prices.1
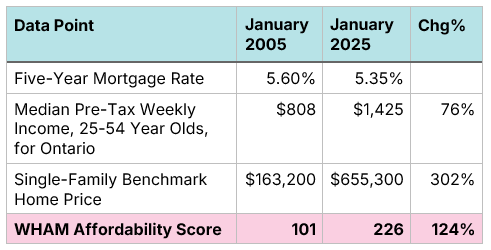
WHAM scores give a bleak outlook on how much housing affordability has deteriorated for middle-class families. In London, Ontario, single-family home prices have risen by over 300% over the last twenty years, while wages have risen by only 76% (neither figure is adjusted for inflation). With mortgage rates returning to their levels 20 years ago, the number of weeks of income needed for a 20% downpayment and five years of mortgage payments has risen by 124%, from 101 weeks to 226.
Figure 1. WHAM Inputs and Housing Affordability for London, Ontario
The challenge with WHAM Scores is they lack context. Baseball fans know that a .300 batting average is excellent and a .200 average less so. But what about a WHAM score of, say, 137?
Let’s fix that. We can examine the evolution of WHAM scores over time and link them to the federal government’s standard of affordability (shelter costs should be under 30% of pre-tax income) to provide the following categorization of WHAM scores.
Deeply Affordable (WHAM score under 100)
Affordable (WHAM score from 100-150)
Unaffordable (WHAM score from 150-200)
Deeply Unaffordable (WHAM score from 200-250)
You Will Never Own a Home (WHAM score above 250)
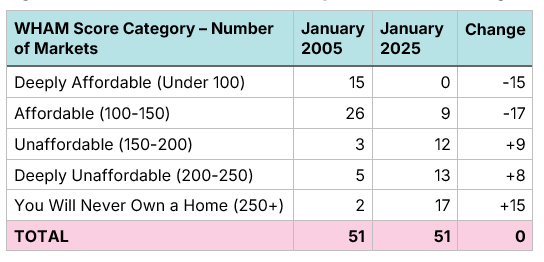
Using data from the Canadian Real Estate Association, we can generate WHAM scores for 51 different local markets between January 2005 and January 2025. We find a massive but uneven deterioration of affordability across Canada.
Figure 2. Number of Canadian Markets by WHAM Score for Single-Family Homes
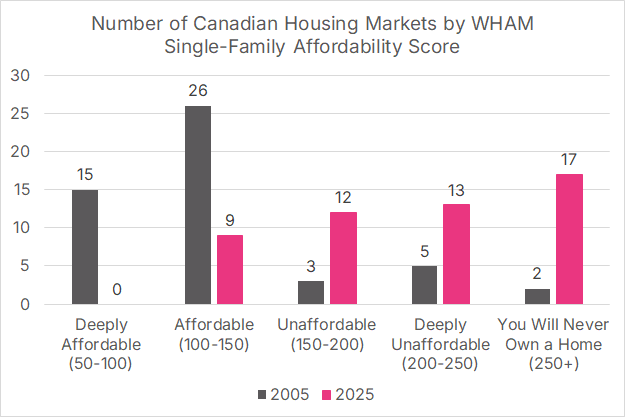
This decline in affordability is so breathtaking it needs to be expressed in multiple forms. Here’s a bar graph with the same data.
Figure 3. Number of Canadian Markets by WHAM Score for Single-Family Homes
There is not a single market in Canada where housing affordability has improved in the last twenty years. However, some markets experienced faster affordability declines than others. The median Canadian market had a WHAM score of 120 (Affordable) in January 2005, which increased by 99 weeks to 219 (Deeply Unaffordable) by January 2025.
In an exercise like this one, we know that most readers will skip a lot of the text and scroll down to see how their community rates. To facilitate that, we’ve created four tables based on 2025 WHAM scores with very minimal commentary.
Figure 4. Affordable Single-Family Housing Markets by Jan 2025 WHAM Score
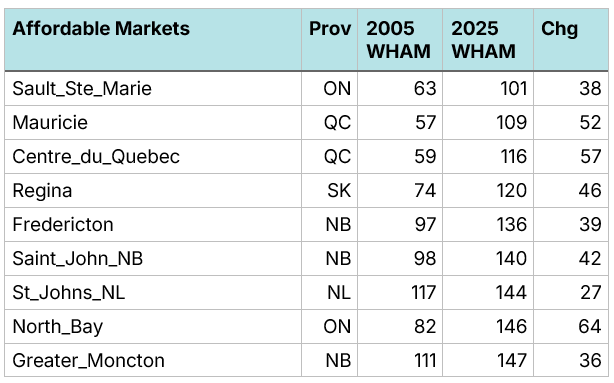
Outside of St. John’s and Moncton, these were all formerly deeply affordable communities that transitioned into the affordable category by 2025, though all nine markets had WHAM increases smaller than the median. Newfoundland, New Brunswick, and Saskatchewan were also three of the four provinces where wages grew the fastest, in percentage terms, over the past 20 years, which has helped their affordability. It is a good reminder that home prices are only one of three components of housing affordability; wages play an important role as well.
Speaking of wages, one limitation of WHAM Scores is that they utilize province-level wages due to limitations in Statistics Canada data. As such, they may not fully reflect local conditions in large provinces like Ontario and Quebec. We suspect that adjusting for this would not materially alter the results for communities such as Sault Ste. Marie and Mauricie, but it is something to keep in mind.
Figure 5. Unaffordable Single-Family Housing Markets by Jan 2025 WHAM Score
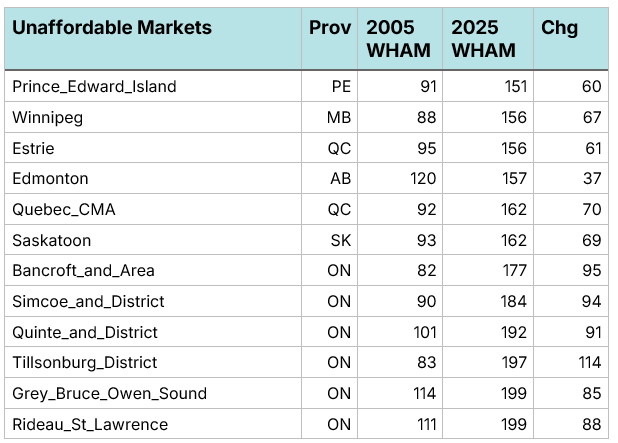
This tranche of markets includes several southern Ontario communities a fair distance away from the City of Toronto. This includes Tillsonburg, which had formerly been one of the most affordable communities in Canada and which is now verging on becoming deeply unaffordable.
When it comes to big-city housing affordability, Edmonton is Canada’s biggest success story.
Figure 6. Deeply Unaffordable Single-Family Housing Markets by Jan 2025 WHAM Score
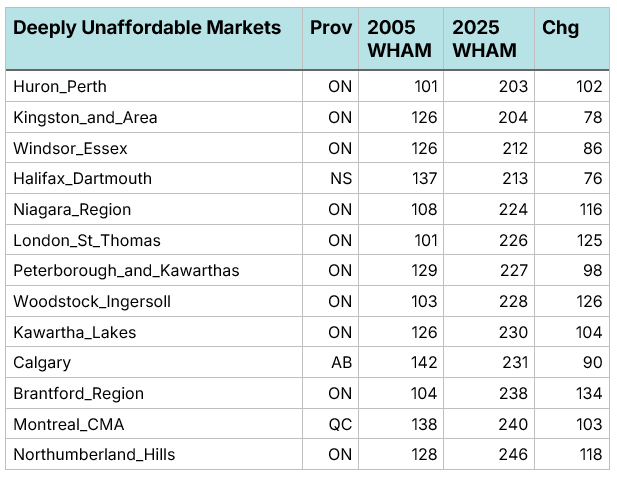
Every single one of these markets had been affordable in 2005. By 2025, they had not only lost their “affordable” status, but they leapfrogged over unaffordable to deeply unaffordable. Not surprisingly, the list is dominated by communities in Ontario. Calgary and Edmonton had nearly identical levels of affordability in 2005. While Edmonton’s only added 32 weeks of income needed for a downpayment and 5-years’ worth of mortgage payments, Calgary has added 90. Both Calgary and Halifax are experiencing substantial declines in affordability due, in part, to the high number of Ontarians moving in. Ontario has been rapidly exporting its housing crisis to the rest of the country.
Figure 7. “You Will Never Be Able to Afford a Home” Single-Family Housing Markets by Jan 2025 WHAM Score
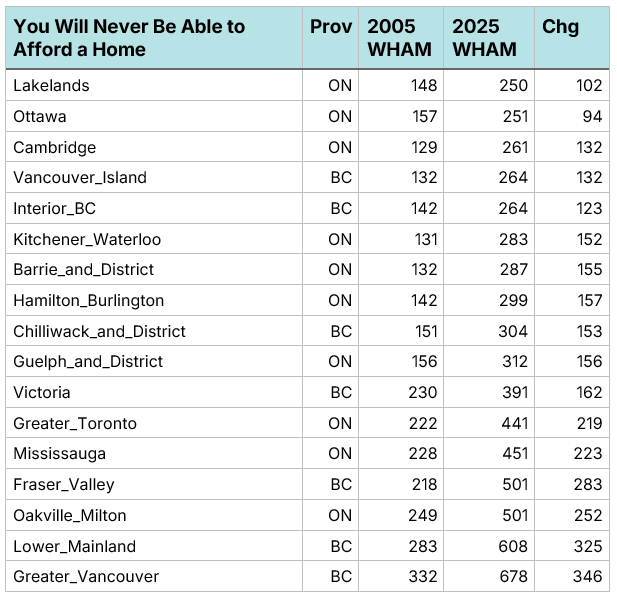
In 2005, only two markets made the “you will never be able to afford a home” list, and even “two” is an exaggeration as they have substantial overlap: Greater Vancouver and Lower Mainland BC. Today, 17 markets, including every single market in British Columbia, are on the list of communities where housing has become completely unattainable. However, if our metric utilized local wages, Ottawa would likely fall from this list to being merely deeply unaffordable.
When it comes to housing which is impossibly out of reach of middle-class families, Canada’s crisis truly is an Ontario and British Columbia one. However, the experiences in Calgary and Halifax show that Ontario and B.C. are exporting that crisis to the rest of the country.
Download a PDF of this article here:
See the piece Weekly Housing Affordability Metric (WHAM) for the full formula. Since the publication of that piece, we have altered the metric slightly to use wages for 25-to-54-year-olds rather than all ages. This suggestion, based on reader feedback, has only a slight impact on the final results but does make them more reflective of homebuyers.