

The Slow-Motion Exodus: How GTA Outmigration Became Ontario’s Defining Trend
A warning for planners: the GTA is losing families faster than the province is willing to admit.

Highlights
Families are leaving the GTA, and have been for years: While many assume this migration is a pandemic-era phenomenon, data from Statistics Canada show it has been unfolding steadily for two decades, with Toronto and Peel now losing more than 15 and 20 residents per 1,000 annually to other parts of Ontario.
Former GTA boom regions are now experiencing a decline in residents: Halton and York Regions, once major destinations for families leaving the City of Toronto, have seen their net inflows collapse or reverse entirely, transforming from magnets of growth in the 2000s to regions of net outmigration today.
Migration patterns have shifted from the GTA to smaller centres. Communities such as Simcoe, Dufferin, and Haliburton were early beneficiaries; however, since 2016, growth has accelerated across a much wider geography, including Census Divisions far from the GTA, such as Elgin, Lanark, and Prescott and Russell.
Areas south of Hamilton are not a migration hotspot: Once stagnant or losing residents, areas like Brant and Haldimand-Norfolk are now gaining as many as 20 new residents per 1,000 annually through migration from the GTA.
Ontario’s official forecasts don’t reflect reality: Despite clear evidence of accelerating migration away from the GTA, the Ministry of Finance projects these flows will slow dramatically, an assumption that risks chronic under-planning for housing and infrastructure in the communities where families are actually moving.
Driving until you qualify
One of the major themes in MMI’s work, as seen in reports such as Families on the Move, is that intraprovincial migration (i.e., individuals' families moving from one part of the province to another) is shaping the face of Ontario in ways that continue to be poorly understood by policymakers.
Over the past two decades, families that once lived in the Greater Toronto Area have increasingly chosen to live elsewhere in the province, a pattern that began long before the pandemic and has since accelerated. The provincial government is betting that these trends will reverse; a bet that could cause the housing crisis to persist.
This outmigration of population from the GTA to other parts of the province is shown in Figure 1. Over the past four years, the City of Toronto has lost, on net, 45,000 people to other parts of the province, while Peel Region has lost 37,000. Halton and York, which had once been prime destinations for these families, are experiencing little net growth from intraprovincial migration, with York Region experiencing a net outflow of residents to other parts of the province in the mid-2010s.
Figure 1: Average annual net intraprovincial migration by time period and census division, four GTA-area census divisions
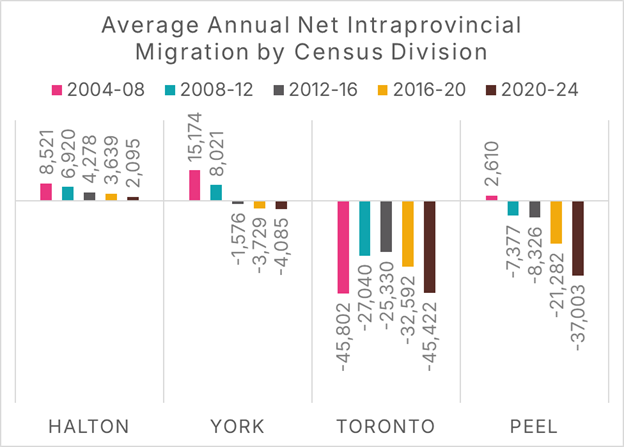
Data Source: Statistics Canada Table 17-10-0153-01, Chart Source: MMI.
The populations of these four census divisions differ significantly, with the City of Toronto being substantially larger than the other four. We can control for this by examining intraprovincial population flows per 1000 residents. Figure 2 shows that, on average, between 2004 and 2008, Halton Region gained a net 18 people from intraprovincial migration every year per 1,000 residents. Over time, this has been reduced to 3 per 1000. York Region went from a net annual gain of 16 residents per 1000 from intraprovincial migration to a net loss of 3. Toronto loses a net 15 residents per 1000 to other parts of the province, and Peel loses a whopping 23. It is essential to recognize that this is not merely a post-pandemic phenomenon, but rather one that has been developing over the past two decades.
Figure 2: Average annual net intraprovincial migration by time period and census division, four GTA-area census divisions, per 1000 residents
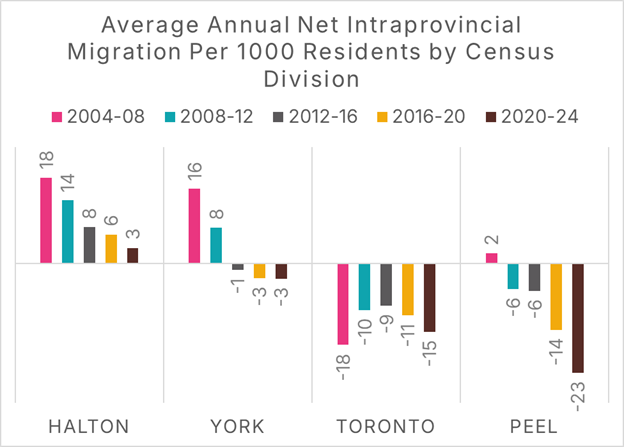
Data Source: Statistics Canada Table 17-10-0153-01, Chart Source: MMI.
To illustrate the growing migration trend over time and to show where these families are moving to, we can map the Southern Ontario data over each of the four-year periods.
Figure 3 illustrates the net annual average intraprovincial migration per 1,000 residents during the pre-Financial Crisis period of 2004-08. The City of Toronto was the only community experiencing a large proportion of its population leaving through intraprovincial migration, although manufacturing centres such as Essex and Chatham-Kent also saw declines.
The most popular destinations for these families were Halton Region, York Region, Durham Region, as well as Haliburton and Simcoe Region.
Figure 3: Average annual net intraprovincial migration per 1000 residents, July 1, 2004 to June 30, 2008, by Southern Ontario census division
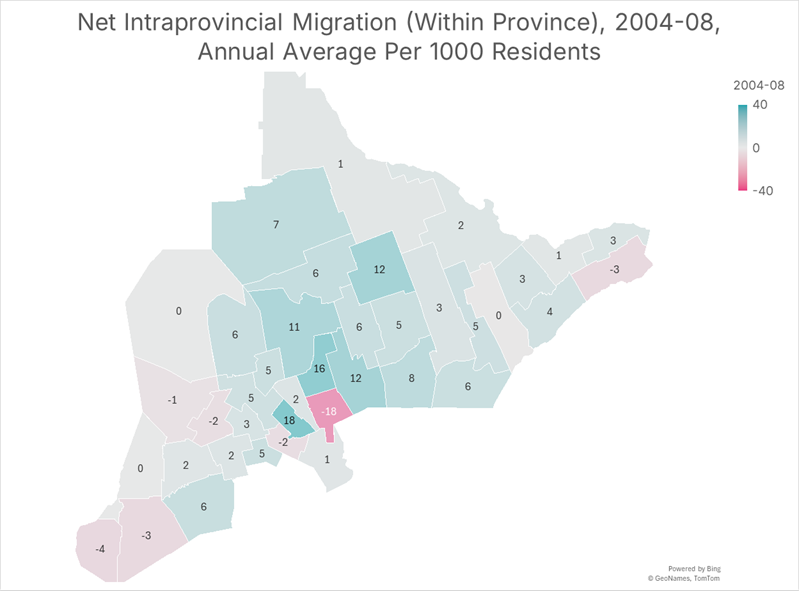
Data Source: Statistics Canada Table 17-10-0153-01, Chart Source: MMI.
Migration picked up during and after the Financial Crisis, though the City of Toronto’s net intraprovincial outmigration fell by nearly half. Manufacturing centres in Southwestern Ontario continued to see families move to other parts of the province, and Peel Region began to experience net intraprovincial outmigration. Haliburton and Halton remained top destinations for families.
Figure 4: Average annual net intraprovincial migration per 1000 residents, July 1, 2008 to June 30, 2012, by Southern Ontario census division
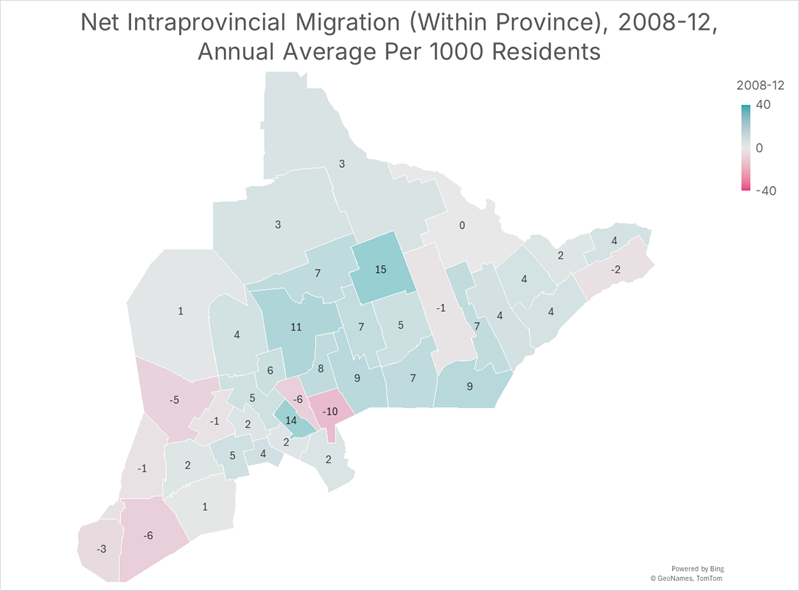
Data Source: Statistics Canada Table 17-10-0153-01, Chart Source: MMI.
Between 2012 and 2016, net intraprovincial outmigration remained steady in Toronto and the Peel Region, but York Region transitioned from being a place where families moved to, to a place from which families moved. Dufferin’s popularity increased as a destination, and Simcoe Region remained strong. Net intraprovincial migration to Halton Region fell by more than half from 2004-08.
Figure 5: Average annual net intraprovincial migration per 1000 residents, July 1, 2012 to June 30, 2016, by Southern Ontario census division
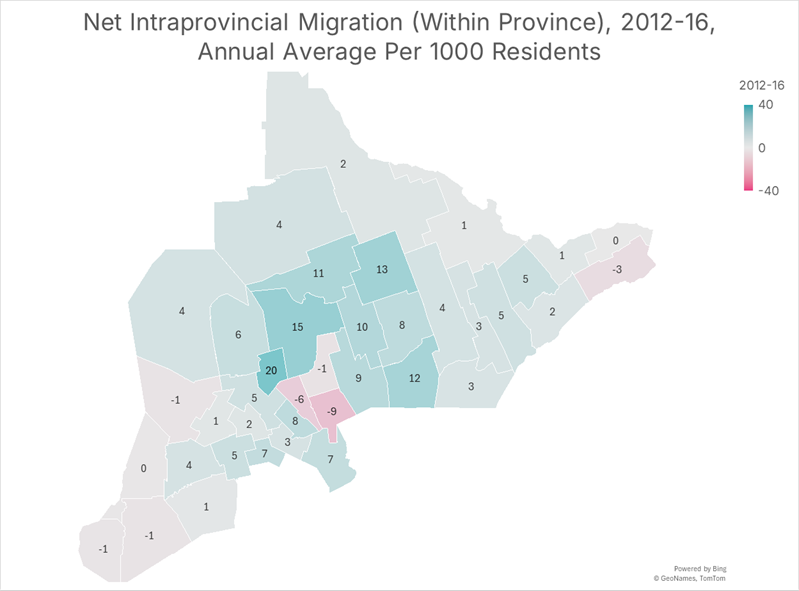
Data Source: Statistics Canada Table 17-10-0153-01, Chart Source: MMI.
Ontario’s population boom began in 2015-16, and is reflected in the migration data. The City of Toronto, York Region, and Peel Region all experienced significant outmigration. Southwestern Ontario communities such as Elgin County began to experience an influx of residents from other parts of the province. Lanark Census Division, near Ottawa, also became a popular destination for families.
Figure 6: Average annual net intraprovincial migration per 1000 residents, July 1, 2016 to June 30, 2020, by Southern Ontario census division
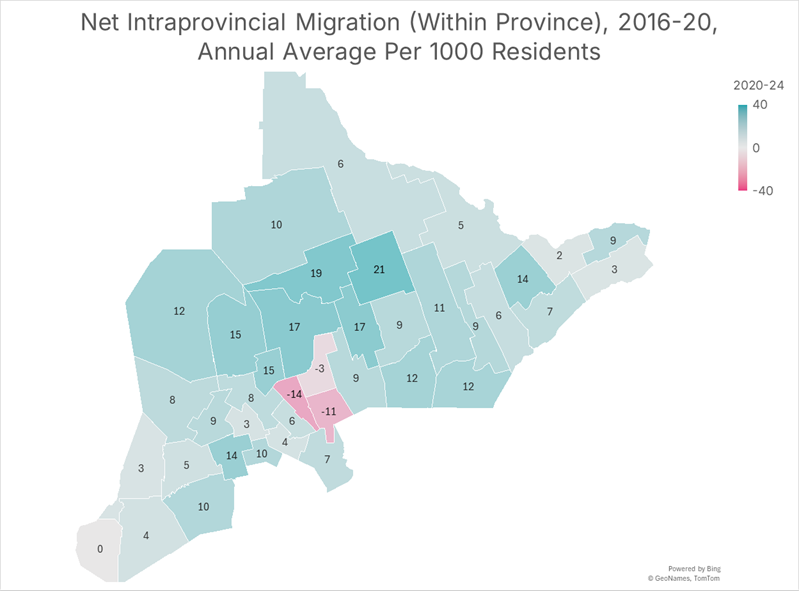
Data Source: Statistics Canada Table 17-10-0153-01, Chart Source: MMI.
These migration trends intensified during the pandemic and post-pandemic period, with the Peel Region experiencing particularly high levels of net outmigration to other parts of the province. Between 2008 and 2012, no region in Southern Ontario experienced annual population growth from intraprovincial migration exceeding 15 residents per 1,000. Between 2008 and 2012, 14 of 40 regions experienced levels that exceeded this amount, including parts of Eastern Ontario, such as Prescott and Russell, which had not traditionally been considered a destination for families moving from other parts of Ontario.
Figure 7: Average annual net intraprovincial migration per 1000 residents, July 1, 2020 to June 30, 2024, by Southern Ontario census division
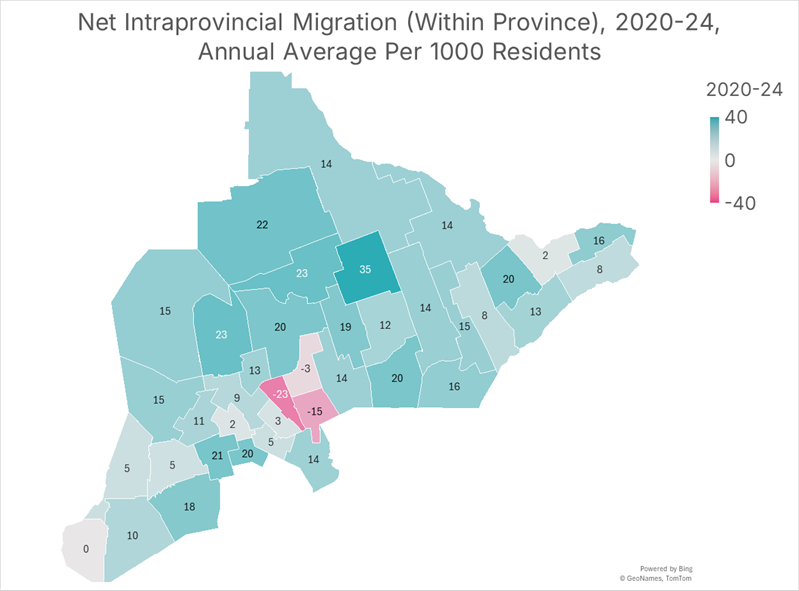
Data Source: Statistics Canada Table 17-10-0153-01, Chart Source: MMI.
The Hamilton-Niagara region serves as a case study in how increased migration out of the GTA has led to a corresponding rise in migration into other parts of the province. Between 2008 and 2012, the Hamilton, Niagara, Haldimand-Norfolk, and Brant Census Divisions each had annual net intraprovincial migration levels of less than 5 persons per thousand, with Haldimand-Norfolk experiencing net outmigration. By 2020-24, each of the four would experience levels at, or above, 5 per 1000, with Haldimand-Norfolk and Brant Census Divisions experiencing annual levels of 20 new residents through intraprovincial migration per 1000 persons.
Figure 8: Average annual net intraprovincial migration by time period and census division, four GGH-area census divisions, per 1000 residents
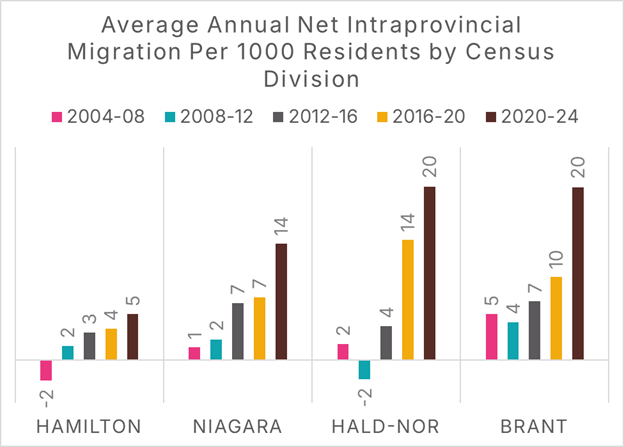
Data Source: Statistics Canada Table 17-10-0153-01, Chart Source: MMI.
Despite this massive and growing trend, the Ministry of Finance’s population projections are based on the idea that this form of migration will be less common in the future:
In the short term, the annual number of intraprovincial migrants is projected to decline from 502,000 in 2024–25 to 462,000 by 2028–29. Over the rest of the projections, it is projected to increase slowly to reach 479,000 by 2050–51. The resulting rate of intraprovincial migration in Ontario declines from 3.1 per cent in 2024–25 to 2.8 per cent in 2028–29, and 2.4 by 2050–51.
Given the past 20 years, this seems incredibly unlikely to us. And these forecasts matter; they are used as the basis for municipal planning in Ontario. Suppose the Ministry ends up being wrong about this, which we believe history will show them to be. In that case, the population of communities outside the GTA will grow faster than planners forecast. Consequently, communities will underinvest in infrastructure and make too little land available for development, resulting in persistent housing shortages, unaffordable home prices, and rents.
Families are voting with their wallets, choosing to live outside the GTA. We must recognize this trend for what it is and plan accordingly.