

When Will Housing Be Affordable Again? Let’s Do the Math
Introducing yet another calculator

Highlights
Over the past few weeks, there has been an intense level of interest in the question of how long it will take housing to become affordable again if prices remain stable.
We have created a free-to-use Affordability Model Calculator, allowing anyone to answer those questions.
Introducing yet another calculator
After the Federal Housing Minister repeatedly suggested that home prices do not need to fall in order for homes to become more affordable, our piece “Can Homes Become Affordable Without Prices Going Down?” became the go-to reference on the amount of time it would take markets to become affordable again, without prices going down. From that piece, we received a number of fantastic questions, inquiring about how the results would change if we altered a few of the assumptions.
To help address these questions, we developed a free-to-use Affordability Model Calculator, allowing users to see for themselves how long it would take for homes to become affordable again in a market with stable prices, under various assumptions.
Here is a set of instructions on how to use the calculator.
Input your data and assumptions
There are six editable fields, with peach coloured cells, as shown in Figure 1.
Figure 1: Inputs in the Affordability Model Calculator
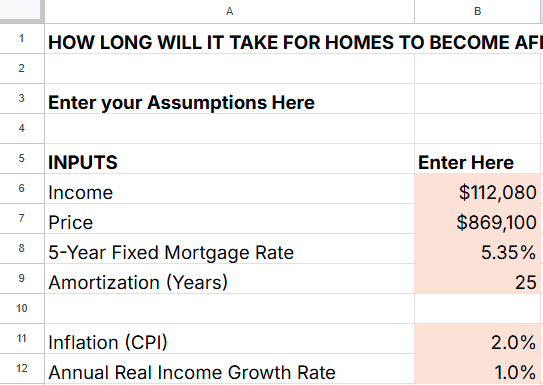
Source: Affordability Model Calculator
For the six fields, the list below shows where our team obtains the data, along with the assumptions we typically use. However, because each field is editable, users are free to make any assumptions they wish.
Income: For the most up-to-date estimate of pre-tax middle-class family income, we use 80 times the median weekly earnings of full-time workers aged 25-54, as found in Statistics Canada Table 14-10-0063-01. As we saw in the article "Southern Ontario’s Home Affordability Crisis Remains at Near-Record Levels," it accurately matches annual income data but is released on a far more timely basis. This data is available at the provincial level.
Price: The Canadian Real Estate Association (CREA)’s National Statistics page contains updated monthly home price data. We use single-family home prices in our calculations.
5-Year Fixed Mortgage Rate: Statistics Canada Table 34-10-0145-01 contains this data, updated monthly.
Amortization (Years): We typically use 25 years, but users can adjust this value to their preference.
Inflation (CPI): Canada has a 2% inflation target, so we use this as our assumption for inflation going forward.
Annual Real Income Growth: Real family incomes have grown by an average of less than 1% over the past 40 years. We typically use 1% as our assumption, but users can enter higher or lower values to see how faster (or slower) income growth impacts the pathway to affordability.
Figure 2: Real Family Income Growth by Decade, Canada
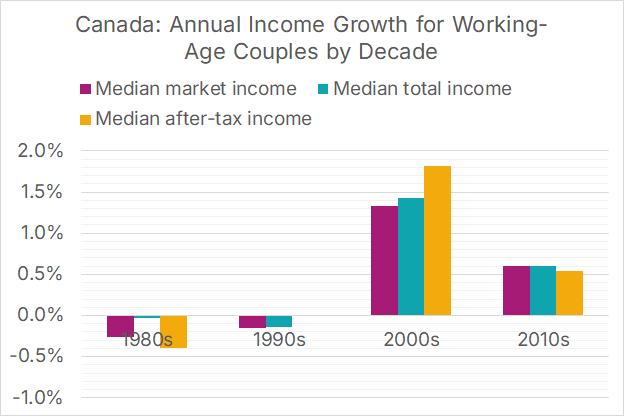
Source: Statistics Canada Table 11-10-0190-01
The calculator will tell you how unaffordable housing currently is
Once you have entered your data and assumptions, the calculator will indicate how unaffordable your market currently is.
Figure 3: Housing Affordability Results
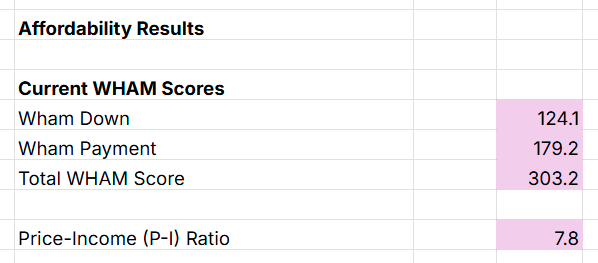
Source: Affordability Model Calculator
Two different metrics of affordability are presented: the market’s WHAM Score, which takes into account prices, income, and mortgage rates, and the price-income ratio, which only takes into account prices and income.
Total WHAM Score: This methodology behind this metric is explained in the piece Introducing WHAM - The Weekly Housing Affordability Metric. It measures the size of a 20% downpayment, along with the value of 5 years’ worth of mortgage payments, in terms of a single full-time worker’s weekly income. Higher numbers = less affordable. The WHAM Score number can be categorized into an affordability category, as shown by Figure 4.
Figure 4: Total WHAM Score categories
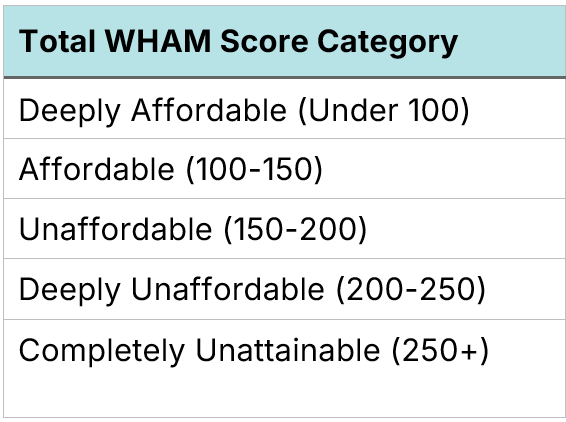
Source: Southern Ontario’s Home Affordability Crisis Remains at Near-Record Levels
In the example shown above, the WHAM score for this market is shown as 303.2, which places it in the “completely unattainable” category.
Price-Income Ratio: This is simply the price of the home divided by family pre-tax income. The old personal finance rule was that this ratio should be no higher than three. Sadly, those days are long gone in most (but not all) Canadian markets. For our example, the estimated Price-Income Ratio is 7.8.
It will also tell you how long it will take for homes to become affordable if nominal home prices stay unchanged
As shown in Figure 5, the calculator will then estimate, based on the provided data and assumptions, the number of years it will take for the market to reach certain affordability thresholds, assuming nominal home prices remain unchanged.
Figure 5: Housing Affordability Projections
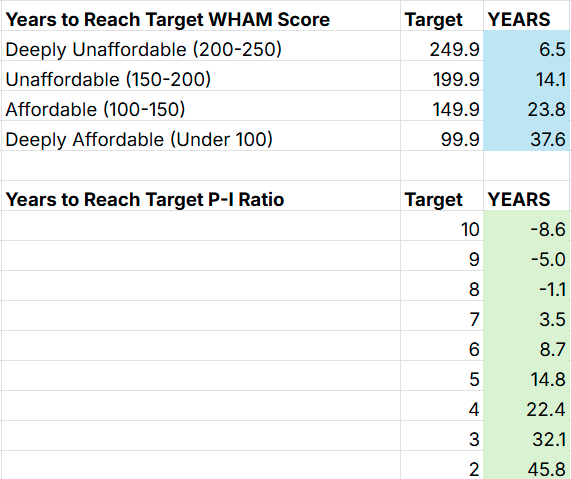
Source: Affordability Model Calculator
If our threshold of affordability is a WHAM Score under 150, then it will take 23.8 years for this market to become affordable once again. On the other hand, if our concept of affordability is a price-to-income ratio of less than 3, then it will take 32.1 years. Negative values indicate that the market has already reached the desired threshold of affordability.
We hope this calculator will be of value to those who want to know if their market can reach affordability in a reasonable amount of time without home prices decreasing.