

Development Charges Continue to Skyrocket
Burnaby's are up $73,900 in just two years

Highlights
Development charges and related taxes and fees on low-rise housing have increased by an average of 33% across Canada in the last two years.
Ontario is an outlier in taxes for both new low-rise and high-rise housing, with the GTA having the highest fees anywhere in Canada.
Municipal housing taxes are substantially higher per square foot basis for high-rise than low-rise housing, which is regressive and violates the spirit of “growth should pay for growth.”
These figures come from the Canadian Home Builders’ Association, which filled a government-created housing data vacuum.
A new report from the Canadian Home Builders' Association (CHBA) shows that development charges and other infrastructure-related fees and taxes continue to rise across Canada. The latest National Municipal Benchmarking Study shows that fees on low-rise development have increased by an average of 33% in just two years and have more than doubled in some communities.
This study, which builds on the GTA-focused BILD Municipal Benchmarking Study and two earlier reports from 2022 and 2020, examines issues ranging from approval speeds to municipal best practices. However, our highlight is the continued escalation in housing taxation.
The Cities with the highest fees for low-rise housing are all in Ontario
The report covers 23 municipalities in Canada, located in every province except Quebec. In its "low rise" scenario, it examines the development charges and other fees for a project with 50 single-detached homes and 75 townhouses, then gives a per-unit figure.
The report ranks municipalities based on their total infrastructure, planning application, and building permit fees. Infrastructure-related fees can include development charges and other fees like parkland dedication and community benefit charges. However, the particular fees relevant to each housing type in each province differs. The report takes this into account, ensuring that municipalities in different provinces can be compared on an apples-to-apples basis.
The municipal ranking for the low-rise housing section clearly shows that fees in the Greater Toronto Area are substantially higher than in the rest of the country. However, other parts of the country, particularly in Atlantic Canada, are working hard to catch up. Moncton, Charlottetown, and St. John's have all seen their fees more than double over the last two years, while Burnaby, British Columbia, had the biggest overall increase in fees, at $73,900.
Figure 1. Low-rise development fees
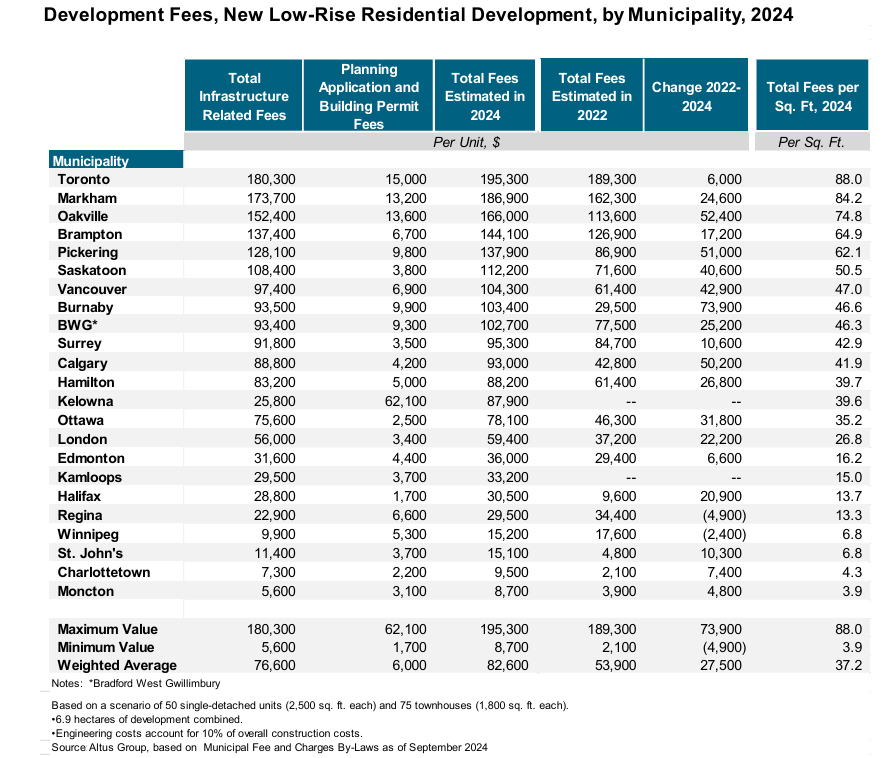
Source: CHBA
The cities with the highest fees for high-rise housing are all in Ontario and BC
In more positive news, the report shows more modest growth in high-rise development fees, though there have been substantial increases in some municipalities, including Burnaby, British Columbia, Toronto, and Pickering. The high-rise scenario is based on a development scenario of 75 small (studio and one-bedroom) and 75 large (two-bedroom) apartments; as with the low-rise scenario, this is then presented as a per-unit figure.
Unlike the low-rise scenario, Ontario does not solely occupy the top five spots. Oakville (#3 in the low-rise scenario) falls to #6 and is replaced by Vancouver.
Figure 2. High-rise development fees
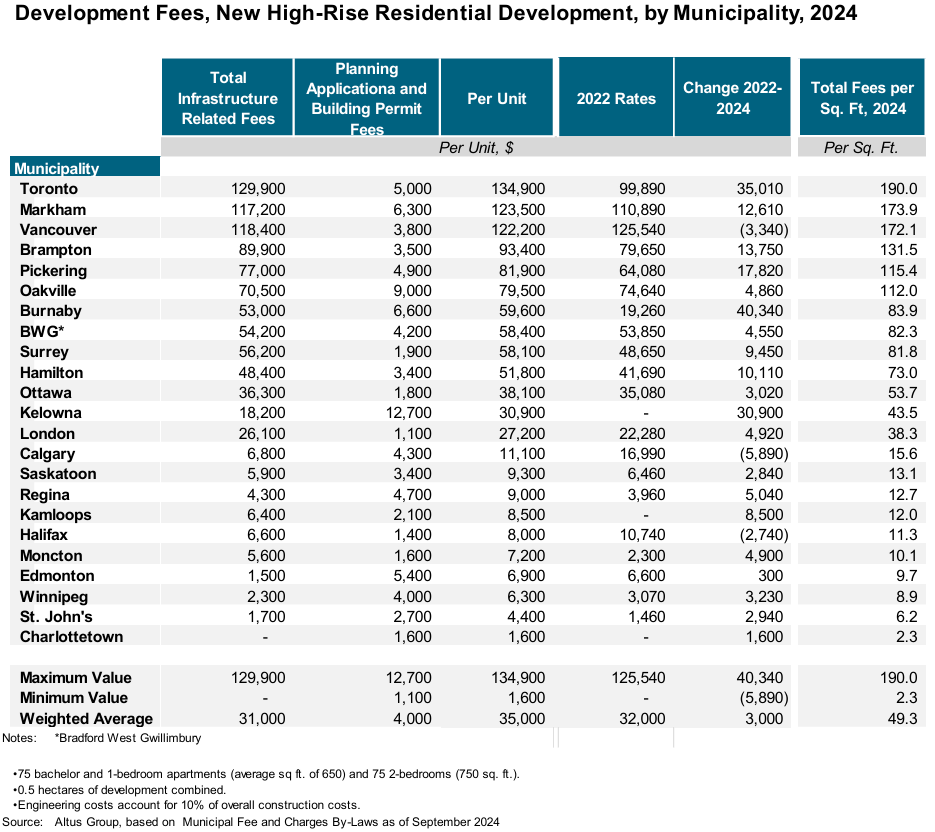
Source: CHBA
High-rise development fees in Ontario and BC are regressive and violate “growth should pay for growth.”
Fees are higher per unit for low-rise development. However, the report makes it clear that fees are much higher per square foot for high-rise homes, at least in Ontario and British Columbia. The higher per-square-foot rates for high-rise homes are in direct contravention of the idea that "growth should pay for growth," as fewer kilometres of road and sewer pipe are needed to support high-rise apartments.
Furthermore, given that apartment-dwelling families have lower incomes on average than those living in ground-oriented housing, this shows the regressive nature of these taxes. Finally, the increasing fees on high-rise development also help explain why these homes are getting smaller, as increasing costs are forcing families to economize.
Figure 3. Total fees per square foot, 2024
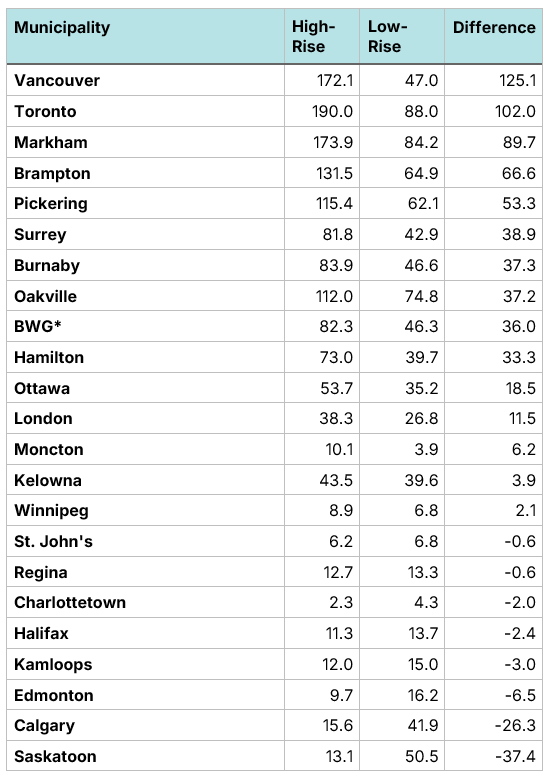
Source: CHBA
Ontario's rise in fees is despite land prices falling in much of the province
The report notes that some individual fees have fallen since 2022. For example, parkland dedication and community benefit charges are housing taxes based on land values. In large parts of the country, home and land prices have fallen since 2022, and as a result, the cost of land-based taxes has likewise fallen.
Despite this drop in overall land values and home prices, the overall tax burden on new housing construction in Ontario has continued to rise, thanks to increases in development charges. For example, Toronto, which had the third-highest rates for high-rise in the 2022 study, jumped to the #1 spot in 2024, with a $35,010, or 35%, increase. This increase is particularly noteworthy given the drop in land values and home prices in the City of Toronto since 2022, which would put downward pressure on parkland dedication and community benefit charges. However, this did not offset the increases in development charges and other fees.
Over the last two decades, municipalities would often justify higher development charges, stating that the market could "absorb" these cost increases due to rising home prices, noting that the higher charges caused prices to rise even faster than they otherwise would have. The converse to this logic is that during a time of falling home prices, development charges should be lowered. But instead of following this common-sense reasoning and lowering these charges, municipalities continued to raise them. These higher taxes, in combination with lower home prices, have rendered most potential projects unprofitable, substantially contributing to the province's collapse in housing starts.
Places that have high fees and long application times have bad housing outcomes
We often get asked, "When it comes to the housing crisis, do high development charges really matter?" The evidence on this is not as strong as we would like, largely because of a lack of data, but we have had a number of pieces showing that high DCs price the middle-class out of housing, they reduce the supply of housing, and, ironically, they can reduce the amount of money municipalities have to spend on infrastructure.
The problems created by high housing construction taxes resonate with the general public, as Ontarians believe that lowering development charges should be the provincial government's top housing priority.
The CHBA report examines this question by comparing an index of municipal benchmarks, which includes development fees, application timelines, and planning features, with an index of housing outcomes (affordability, suppressed household formation, rental vacancy rate, and migration).
The report finds a strong correlation between municipalities with bad housing outcomes and poor benchmarking performance. The longer it takes to approve housing and the higher the fees, the worse a municipality tends to be in terms of issues like vacancy rates and building enough housing to accommodate demographic changes.
The worst cities are all located in Ontario, followed by BC, while the best cities are in the Prairies and Atlantic Canada. Edmonton, Moncton, and Calgary are noted for doing well by both measures.
While correlation is not causation, it would be hard for anyone to argue that housing in a difficult-to-build area will ever be affordable. Cities located in the heart of the housing crisis, most notably those in the Greater Toronto Hamilton Area (GTHA) and Metro Vancouver, clearly have a lot of work left to do to become places where abundant housing can occur.
Figure 4. Housing outcomes vs. municipal benchmarking index
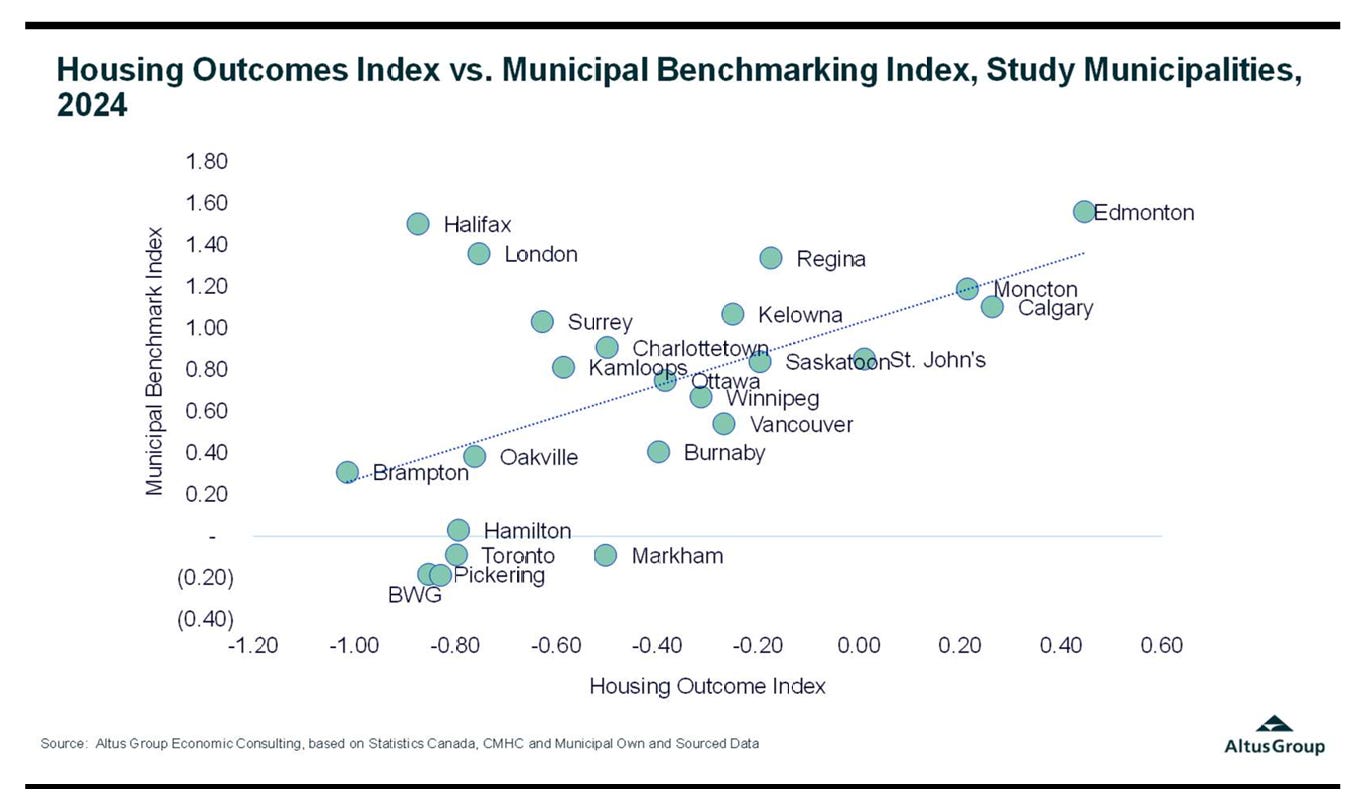
Source: CHBA
Policymakers should be concerned that the places with the worst housing outcomes also tend to have the highest taxes on new housing and the longest approval timelines. Those poor outcomes include record numbers of families moving out of the Greater Toronto Area due to a lack of family-sized homes, which harms the region's economic resiliency.
The existence of this report is an indictment of government data collection
While there is a fair bit of analysis in the report, the data itself is a substantial contribution. The data on the length of time needed to get a permit in a city to the average development charge rate for a particular municipality is the kind of basic housing data that governments or the CMHC should be collecting, but they don't.
There is a substantial lack of transparency, which allows politicians to make erroneous claims, such as the claim that development charges have increased at the rate of inflation over the last two decades, without a simple way for the media and the public to separate fact from fiction. This data and transparency vacuum left by governments has forced groups like the Missing Middle Initiative to step in and create a data repository and industry groups like the Canadian Home Builders' Association to issue reports like this one.
In our view, the government, not industry, should be collecting and hosting basic data on Canada's housing system. However, since all orders of government are failing to do so, we are incredibly grateful to the CHBA for filling in the gaps.
Download a PDF of this article here: