

What Would It Take for Your Kids to Afford a Home in Hamilton?
Pathways to housing affordability in the Steel City

Highlights
Over the past few weeks, there has been an intense level of interest in the question of how long it will take housing to become affordable again if prices remain stable.
Using our new Affordability Model Calculator from the piece "Southern Ontario’s Home Affordability Crisis Remains at Near-Record Levels," we show that it will take 16 years for single-family homes to be affordable for the middle class in Hamilton-Burlington in a stable-price environment.
There is no reasonable pathway to affordability without addressing the cost-of-delivery crisis, which can include enhanced HST rebates on new homes. We need new home prices to be substantially lower than they are today.
Hamilton-Burlington as a case study
As someone who has spent most of his adult life at Ivey Business School, Mike is a fan of case studies. In a recent piece, we used the construction of a Vancouver condo as a case study to illustrate how development charges interact with the GST and provincial property transfer tax to add hundreds of thousands of dollars to the cost of construction.
Today, we will use the housing markets of Hamilton, Ontario, and Burlington, Ontario, as a case study to illustrate how it would take nearly two decades for family-sized homes to become affordable to the middle class, unless prices fall.
Hamilton-Burlington is unaffordable under any measure
There are two measures we commonly use at the Missing Middle to measure affordability. The first is price-to-income ratio. Until 2011, Hamilton-Burlington had a single-family home-to-pre-tax family income ratio at, or somewhat below, four. Ideally, we would like to see a ratio of 3 or less, but four is still quite affordable, particularly in contrast to what was yet to come.
At the beginning of 2011, it would begin to climb, reaching five by February 2014, six by March 2016, and seven by February 2017. It hovered around seven until the beginning of the pandemic, after which it spiked, reaching a peak of 11.6 in February 2022. It has declined since then and fallen to under eight by the end of 2024.
Figure 1: Price-to-Income Ratio for Hamilton-Burlington
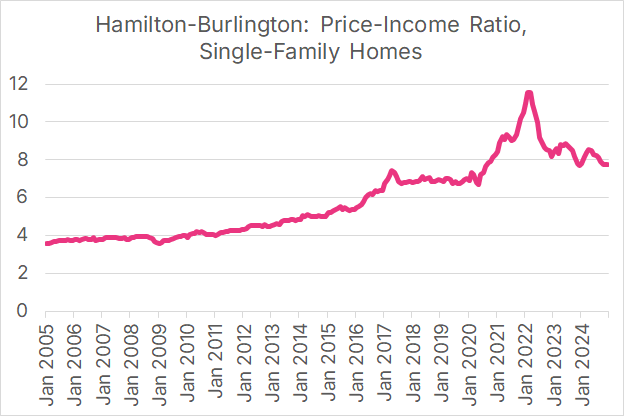
Source: Author’s calculation, using data from Southern Ontario’s Home Affordability Crisis Remains at Near-Record Levels
A more comprehensive measure is our WHAM Score metric, which considers prices, incomes, and mortgage rates. Not surprisingly, it shows a similar trend. Until 2011, Hamilton-Burlington’s total WHAM score was around 150, which is the dividing line between affordable and unaffordable. After 2011, the market’s WHAM Score would rise, indicating deteriorating affordability, breaking 200 by 2016 and 250 by 2017. During the pandemic, it reached a high of 400 before falling to 300 by the end of 2024.
Figure 2: WHAM Affordability Metric, Single-Family Homes, Hamilton-Burlington
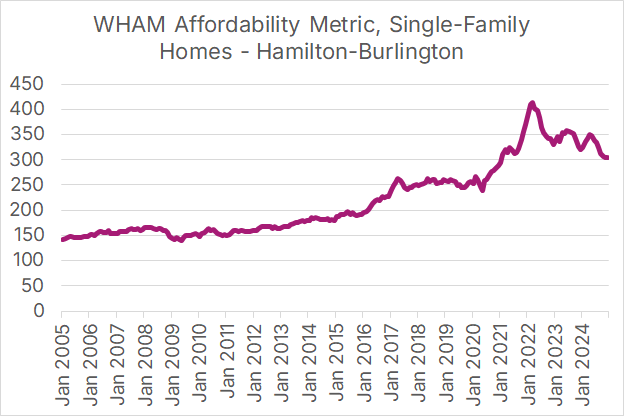
Source: Author’s calculation, using data from Southern Ontario’s Home Affordability Crisis Remains at Near-Record Levels
WHAM Scores above 250 are considered to be completely unattainable for middle-class families; that is, a family with a median income would not qualify for a mortgage to buy a single-family home.
Using our WHAM Score, we can break the Hamilton-Burlington market into affordability eras. Two important things to note:
There was a time in the not-so-distant past (a.k.a prior to 2011) when single-family homes were reasonably affordable for middle-class families in Hamilton-Burlington.
Hamilton-Burlington had a middle-class housing affordability crisis well before the pandemic.
Figure 3: Hamilton-Burlington Middle-Class Housing Affordability Eras
Source: Author’s calculation, using data from Southern Ontario’s Home Affordability Crisis Remains at Near-Record Levels
This data raises the obvious question: How long would it take for homes to become affordable again, particularly if prices do not fall?
The answer: Even under the best-case scenario, it would take 16 years.
It would take 16 years for homes to become affordable again without prices going down, even under the most generous assumptions
Using our free Affordability Model Calculator from the piece “When Will Housing Be Affordable Again? Let’s Do the Math”, we can plug in some very generous assumptions to determine how long it would take under a best-case scenario for homes to become affordable again without prices going down.
Our assumptions are shown in Figure 4.
Figure 4: Hamilton-Burlington Affordability Assumptions
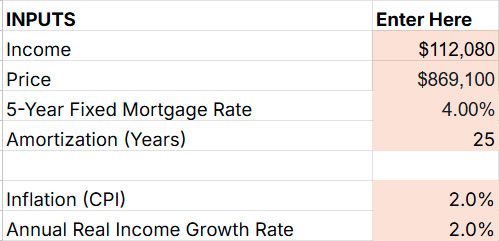
Source: Affordability Model Calculator
Here are the details on each:
Income: $112,080 is our estimate of middle-class family income as of December 2024. To obtain this figure, we use 80 times the median weekly earnings of full-time workers aged 25-54, as found in Statistics Canada Table 14-10-0063-01. As we saw in the article "Southern Ontario’s Home Affordability Crisis Remains at Near-Record Levels," it accurately matches annual income data but is released on a far more timely basis.
Price: We use $869,100, which was Hamilton-Burlington’s benchmark single-family home price as of December 2024. This value has since risen to $900,000 as of April 2025. The data is from the Canadian Real Estate Association (CREA)’s National Statistics page.
5-Year Fixed Mortgage Rate: The WHAM Score calculation uses Statistics Canada Table 34-10-0145-01 for 5-year mortgage rates. As of March 2025, this rate is 5.22%. For a best-case scenario, let’s assume this rate falls to 4%. This would return rates to the 2013-20 levels, noting that low rates make it easier for buyers to finance homes, which would put upward pressure on home prices. Having exceptionally low rates and non-rising home prices would be a goldilocks scenario.
Figure 5: Five-Year Fixed Mortgage Rates since 2013, Canada
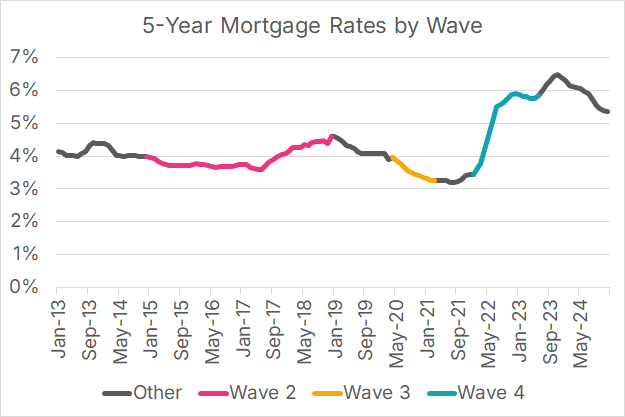
Source: Author’s calculation
Amortization: We will use the standard 25-year term. We could raise it, which would lower monthly payments, but also mean that buyers are in debt longer. So we will leave it as-is.
Inflation: Canada has a 2% inflation target so that we will stick with that. We could raise it, which would increase affordability faster, as the model predicts that nominal incomes grow more rapidly in a high-inflation environment. However, higher inflation is undesirable, and it seems unlikely that we could have a high-inflation environment that would impact all prices except those of homes.
Annual Real Income Rate: We will be very generous here and assume Hamilton-Burlington’s real (inflation-adjusted) family income growth reaches 2% a year, a level Canada has not consistently experienced since the early 1970s.
Figure 6: Real Family Income Growth by Decade, Canada
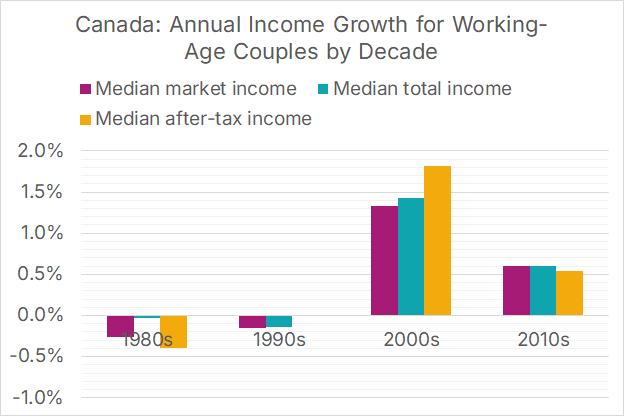
Source: Author’s calculation, using data from Statistics Canada Table 11-10-0190-01
Keeping home prices from increasing in an environment where families are rapidly getting wealthier would be an amazing feat, but once again, we are looking at a best-case scenario.
With these inputs, our calculator spits out the following timelines.
Figure 7: Housing Affordability Projections for Hamilton-Burlington
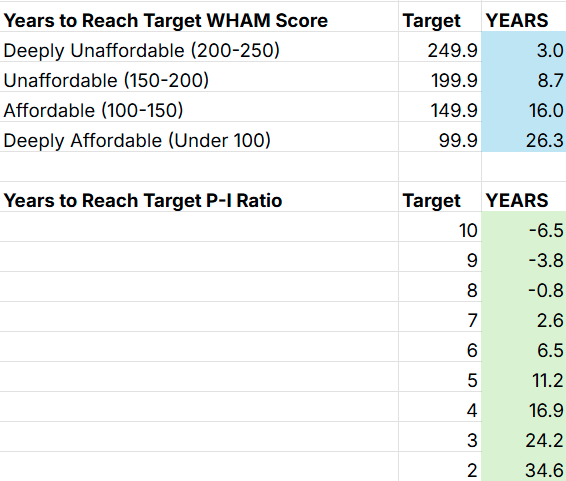
Source: Affordability Model Calculator
If our goal is to have Hamilton-Burlington return to pre-2011 levels of affordability, which had a price-income ratio under four, and a WHAM score hovering around the 150 mark, it would take 16-17 years. And those are under very generous assumptions.
It would also mean that the 39-year-old couple, who are still struggling to buy their first home, would hit Freedom 55 before housing becomes affordable for them.
There is only one pathway to a return to middle-class affordability in a reasonable time frame
In short, we need to build a lot more homes. Not just any homes, but three-bedroom homes, suitable for families, and available for ownership. Very few have been built in Ontario, including in Hamilton, in recent years.
Figure 8. Change in the number of occupied three-bedroom homes (all forms) by tenure, Census 2016 to Census 2021, Ontario Census Divisions with a population growth of 5000+ persons
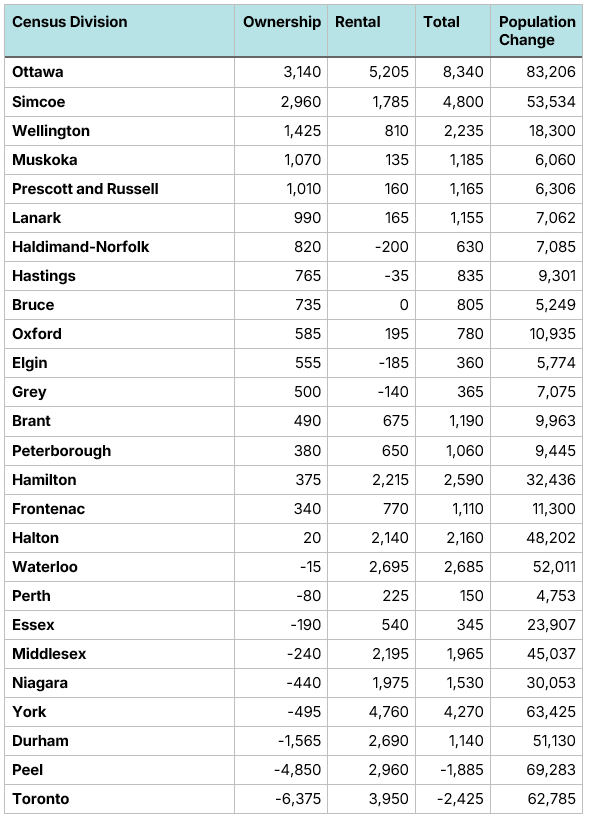
Source: The Baby Bust and the Death of the Three-Bedroom Ownership Home
The only way to build enough of these homes and have them affordable to the middle is to address the cost-of-delivery crisis in homebuilding, while also ensuring that population growth does not exceed our capacity to build new homes. Many policies can address the cost-of-delivery crisis, such as enhanced HST rebates on new homes. An increase in the number of low-priced family homes will put downward pressure on home prices in general, resulting in a decline in the average home price. It is the only true pathway to restoring middle-class affordability.